Zero install on client machinesAny Windows / Linux system with any modern browser, such as: Latest Edge (Windows) Latest Chrome Latest Firefox
iPad / Android Tablets & Mobiles Native HTML5 web application (Responsive)
Simple, flexible, & secure server installServer component Choose your preferred location On-premise Cloud Cloud 2 Cloud
Load Balancing / Failover support (high usage and availability) Light footprint installation Minimum server specification** 2 GHz CPU 4 GB RAM 3 GB free disk space
Containerization support
| Info |
|---|
** Please note these are the minimum requirements to run the server, assuming no other applications are running on the same machine. |
System Memory System memory requirements are something that can vary from customer to customer, due to differences in how the dashboard is used, the number of users and the data connections used. To help illustrate the memory requirements, these are best presented as a formula (if you prefer to auto scale) or a table with some example user numbers as a guide. 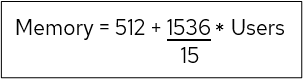 Memory is the amount of memory allocated to the Tomcat server, and Users are the number of concurrent users. Concurrent Users | RAM (GB) |
|---|
Up to 5 | 1 | Up to 50 | 6 | Up to 100 | 11 | Up to 500 | 51 | Up to 1000 | 101 |
Server Software Server operating systems supported Security Authentication: No data is held on the client device Role based access defines what each user can and cannot see Audit Dashboard enables user tracking of access and usage Supports native HTTPS (or via reverse proxy) User restrictions – apply these to control what information can be viewed, without needing to create user specific charts. Ideal for your Sales teams, or for safely and securely exposing parts of the dashboard to customers, suppliers, or other stakeholders
Deployment options Installation Files – we can share these with you via our Customer Portal AWS Marketplace – you can find us on the marketplace, where you can download a ready built instance of the dashboard Docker Images – we can whitelist your dockerhub usernames to provide access to our containers
Application Program Interface (API) RESTful JSON based web service (based on API spec 3) Integrated security Option to seamlessly integrate with your own installer programmes, via a Silent installer
Application integration and embedding OEM Partners can embed any chart into their own applications (HTML components) Ability to embed one chart, one category or the whole dashboard via iframes Application chaining – allows you to link chart data back to your own application via a URL Logon – Single Sign On supported through Waffle (Windows Authentication), Panintelligence API integration, Microsoft Exchange, Keycloak, OAuth and generic OpenID connect providers Import Excel into your data source Export reports to Excel, CSV, Word and PDF Integrate with any SMTP email server Server API’s allow you to integrate your own application with the dashboard Unattended/silent install methods allow for seamless integration with other installers
Styling & Themes Logo – add your own logos into the Dashboard, or that of your customers Colours & Font – use your corporate colour schemes throughout the dashboards
Data Connections / Drivers Multiple data sources supported in a single dashboard – e.g Sales, Finance, CRM, Support No ETL/ELT required – no need to move data from its current location All data is actionable in one portal Multitenancy / SaaS Database introspection Free format JDBC drivers available as standard Default JDBC drivers shipped include: Apache Drill CONNX DynamoDB Firebird HyperSQL iAnywhere IBM DB2 IBM DB2 AS400 IMB Informix Ingres InterSystems JConnect MySQL / MariaDB Mondrian OLAP MS Access Oracle Pervasive PostgreSQL Redshift SalesForce SAP SAP WB OLAP Snowflake SQL Server SQLite Sybase/SAP IQ Sybase Advantage
If you have any specific JDBC requirements not listed above, do let us know and we can look to include those for you Easy to use and shareUser Experience (UX) Feels like a web app rather than a BI tool Fun to use, with visual and quick results Anyone can create a dashboard
Value Added Uses Exception Reporting Office Wallboards – put your dashboards on your office TV’s Schedule Reports to be created and automatically distributed, using pi Reports What-If Scenario analysis, using pi Predict
ArchitectureBelow is an example of how the dashboard architecture is recommended to be delivered for deployment onto a single machine (be that locally or in the cloud), whilst being behind a reverse proxy. 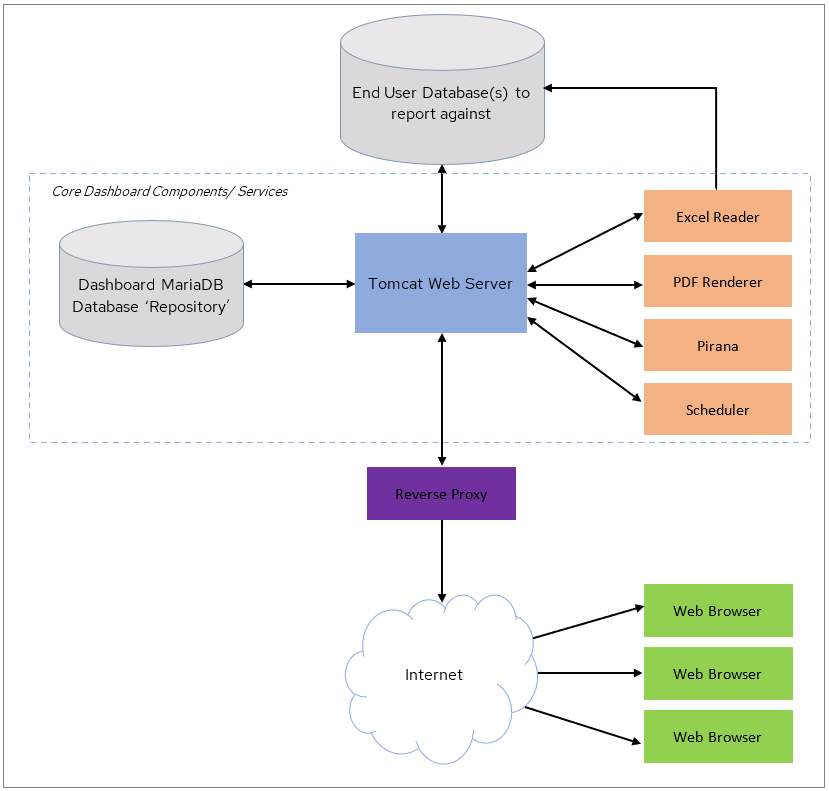 Image Modified Image Modified |