| Excerpt | ||
|---|---|---|
Excel can be used as a data source, which will load Excel columns and rows into your underlying database as a table. When the data changes in the Excel file the table, and therefore the charts, will also be updated. This functionality works with SQL Server, MySQL and MariaDB. For other databases, or non-Excel data, you will need to manually load the file into a table. Your Excel file:
In addition, the database user you have configured for this data connection will need to have been granted create and insert privileges, or equivalents, on the ‘target’ database. 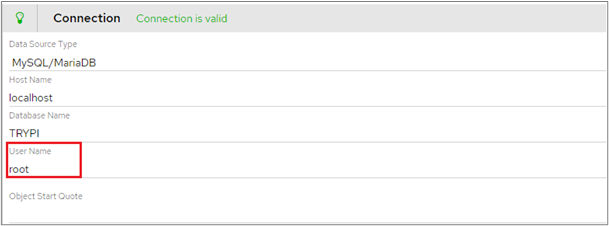 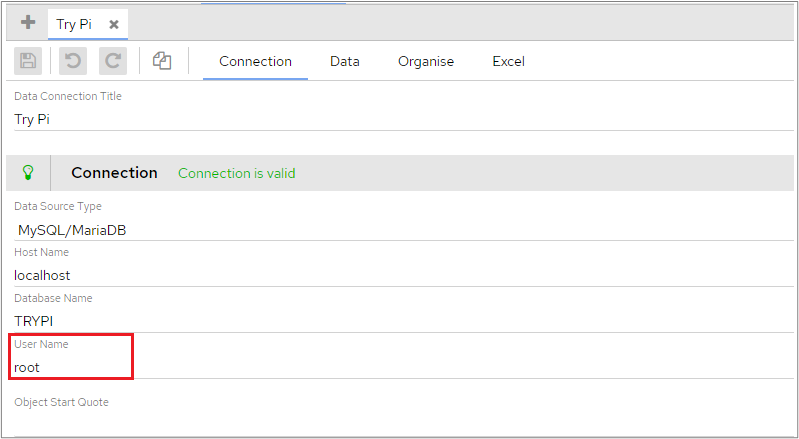 To use Excel as a data source, from within the Data Connection you wish to use:
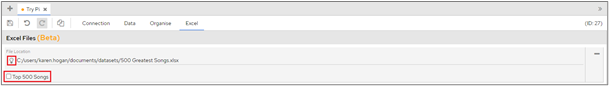
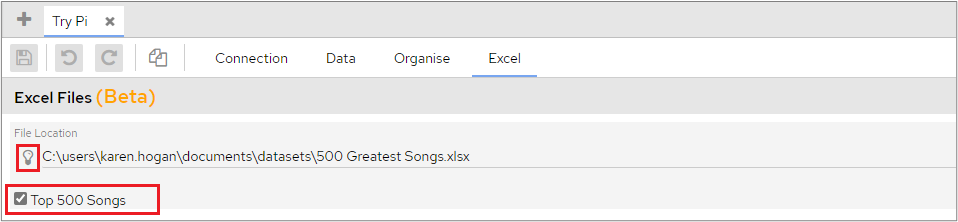
After the Excel file has been added, you will also need to generate the table. Please refer to the section Adding Tables/ Views for more information. When a table has been created, it will be named ‘PI_EXCEL_your_file_name_your_sheet_name’ When the table has been generated you can setup the object metadata as you would do for any other table. Please refer to Object Configuration for more information. If you add an additional sheet to the underlying Excel file it will appear in your dashboard and can be used in the same way. To see the new sheet, you will need to press the ‘Validate location’ icon again on the Excel tab. 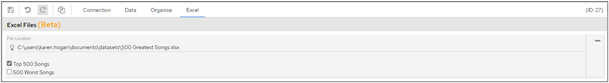 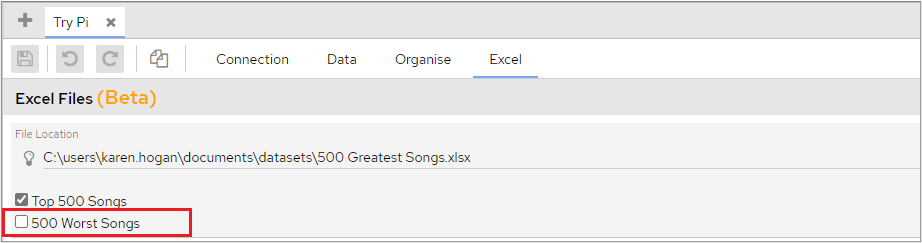 To add additional Excel files, repeat the process detailed above. Once this has been done the tables can be treated as any other data table would be, you could for example create a view over it and then point the dashboard at that view, or you could point the dashboard directly at the table(s) in question.
|
Page Comparison
Manage space
Manage content
Integrations