
We are pleased to present our latest offering of pi - our March 2021 release! This page helps summarise and familiarise you with the changes we have made, and is supported (where applicable) with useful videos to help explain the changes we have delivered.
| Note |
|---|
- in response to a Java security vulnerability around Log4J2, this version of the dashboard needs to be updated to a version from our patched November 21 (inclusive) - or mitigating actions taken to provide security assurances - more information can be found HERE |
| Info |
|---|
Before upgrading, we recommend taking a backup. You can find more information here. |
Here’s what we’ll cover;
| Table of Contents |
|---|
Added
Description
The API description has been updated to clarify minimum version, authentication and filtering.
The v2 API can only be used from version 2020_12_31 or later. * Clarified that
/tokens uses basic authentication (Basic username:password) while all other endpoints use bearer auth (Bearer token-derived-from-basic-auth). * Clarified that users must have permissions to the resources related to an endpoint to use it. * Clarified that the filters that can be used on GET-type API calls follow the format fieldName(operator)=value.
Description
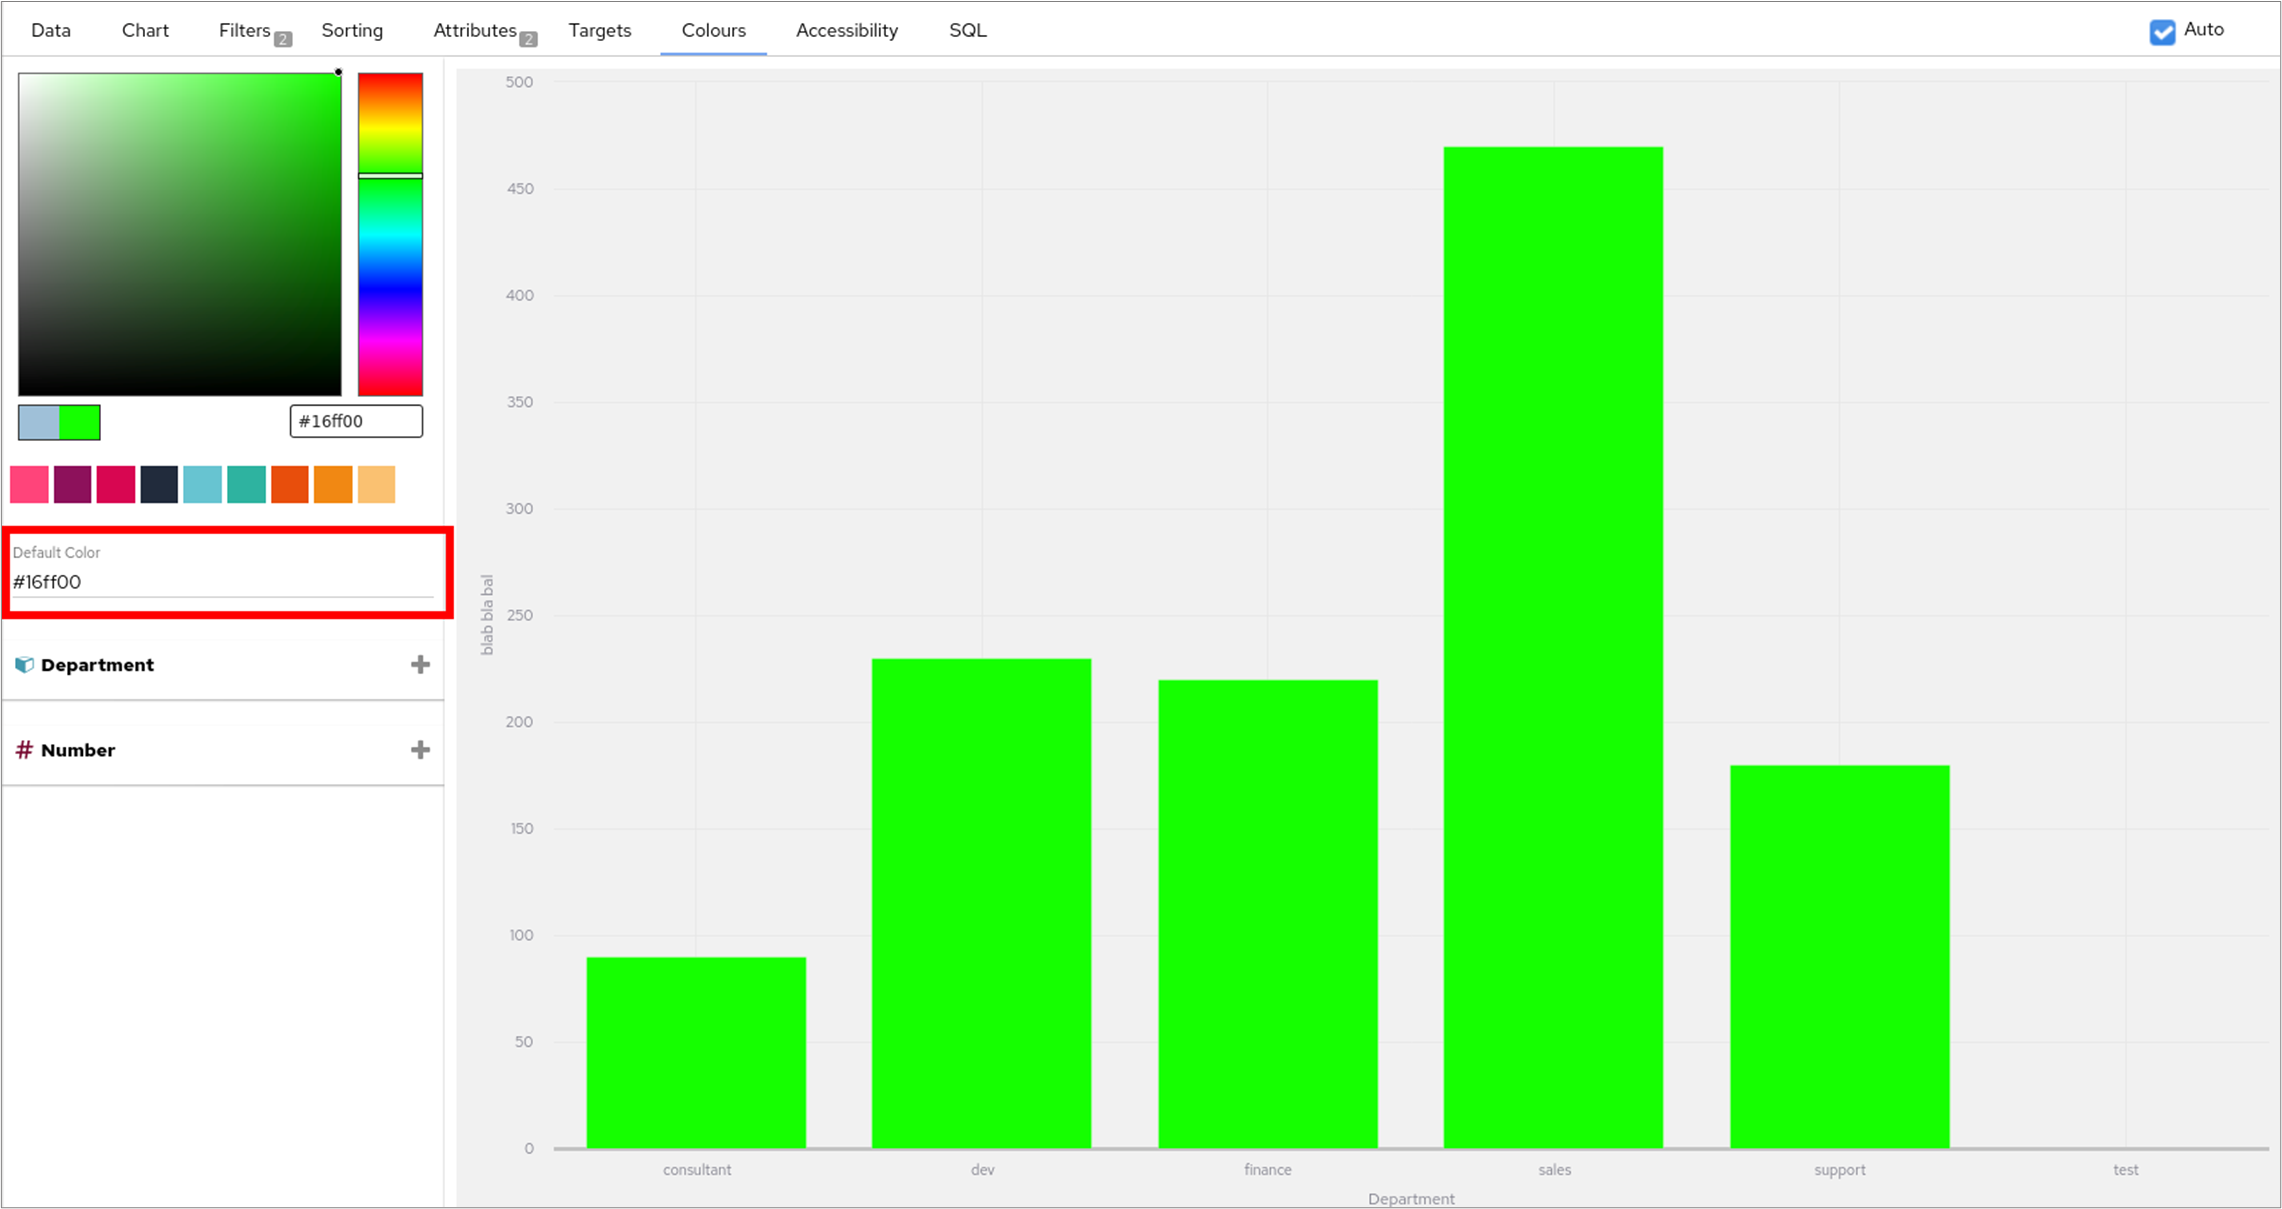
When a chart is created the first colour from the theme is normally selected. A new field, ‘Default Colour' has been introduced and when a value is specified in this field, this colour will be used instead of the first theme colour.
Screenshots
| Info |
|---|
Default Colour will be particularly useful when creating Merged charts. Please see this section for more information. |
Video
We’ve created a short video to explain Default Colours in a bit more detail.
| Confluence youtube macro video | ||||
|---|---|---|---|---|
|
Description
When exporting a table in a report, the table will be split onto the next page if it’s larger than the height of the page. Table headers will be retained and will be visible on the 2nd page. Issues PANINT-8973, PANINT-8974, PANINT-8964 and PANINT-8926 are also related to this item.
| Info |
|---|
Please note that you will experience a decrease in performance when exporting large tables as PDFs. This is because a new table has to be created for each page that it spans across in the report. |
Description
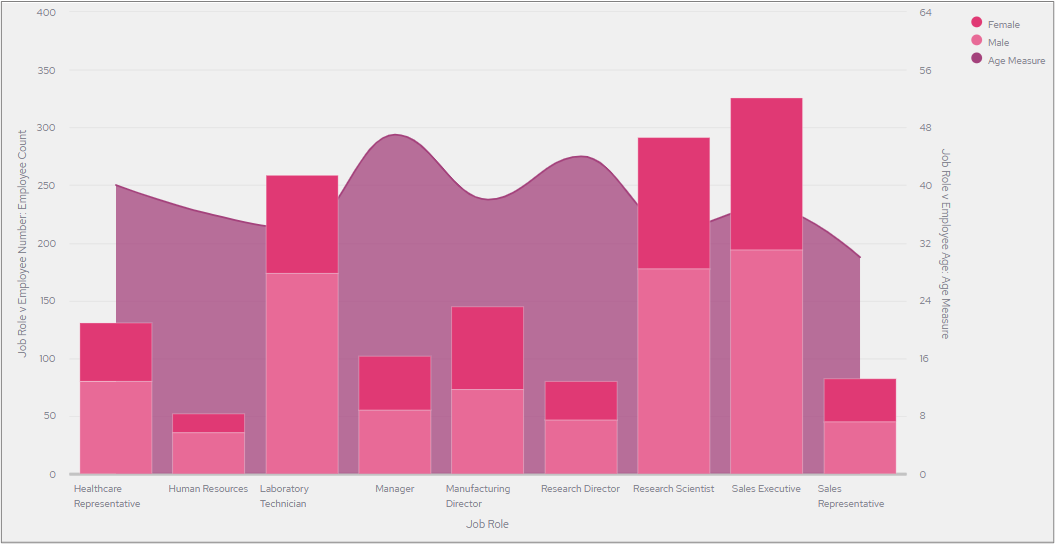
Merged charts allow you to combine three separate charts into one. When using this chart type, you can create and customise each of the three charts separately and apply formatting and attributes for example, filters, sorts, colours and data labels. The merge chart function will merge all the features of each chart into one. Merged charts also allow you to merge charts from different data sources and data connections.
Please refer to this section in pi Documentation for full details.
Screenshots
This example combines a Spline Area chart with a Stacked Bar chart.
Video
We’ve created a short video to explain Merged charts in a bit more detail.
| Confluence youtube macro video | ||||
|---|---|---|---|---|
|
Warnings/Alerts
Certain chart features and attributes must be applied to the individual charts before they are merged and a maximum of 3 charts can be used.
Log levels for the Dashboard can now be configured on the settings screen. The levels can be controlled individually for Panintelligence code, third party code and Tomcat. You should only alter these when trying to diagnose an issue and please take care because they can impact on performance.
The following log levels will be supported:
DEBUG
INFO
WARNING
ERROR
| Info |
|---|
Tomcat log level changes will require a restart of the Dashboard |
The /tokens endpoint now can optionally supply fields to specify who the returned token is associated to
the two fields are “logInAsUserId” and “logInAsUsercode”
if both are provided, use “logInAsUserId”
the userId/usercode needs to be a child user of the log in user
when the token is returned, and we use the token to access the dashboard, the child user logs in
Description
Reports will now use the theme defined onsystem Variables:Themes -> PI_STYLES as the default theme when the report is exported. Please see this section in pi Documentation for more information.
Description
Implemented performance improvement for logging into the dashboard. This reduces processing so that it only does what the system needs at the time that the user logs in.
Some additional setting options have been implemented for API v2.
Summary of changes:
additional fields added to /serverConfigs
added new endpoint /securityConfigs
/securityConfigs cannot be created or deleted, so only GET, GET/id, PUT are available
lastUpdatedViaApi - previously after set by api, system couldn’t set it to false, so this has been fixed
/variables now no longer allows deleting system variables (same principle as securityConfigs)
added /version endpoint to api documentation
Description
A new API endpoint (/tokens/keepAlive) has been added, which is used to keep a token active. This is generally used for embedding to ensure a token is not logged out when the container application session is still active.
Please refer to this section in our API documentation for further details about this endpoint.
Description
The configuration tool executables on the Windows platform are now signed with our digital signature so you can verify authenticity
The new configuration tool is now used by default on Windows and is also available for use on other platforms.
There is a gui version and a command line version available depending on your environment and preference
Your installation will now contain a dashboard.json reference of configuration which can also be supplied to the configuration tool elsewhere to apply the same config
The tool is fully cross platform and the gui or command line can be used on any platform
There is no change to environment variable based configuration as configuration is triggered automatically
Windows Silent Installation
Windows silent installation can be done using the new json file format alongside the /silent or /verysilent flags on the installer
To help with migration the previous silent installation format is supported for a limited period by using the /useportselector flag
Configuration can be skipped entirely by using the /skipconfig flag but then configuration will need to be invoked using the command line tool before the system will be operational
An additional Environment Variable has been added to the Renderer section. This variable, DIE_ON_UNHEALTHY is a Boolean field that is used to kill the container if it reports as unhealthy. This is for orchestrators that only monitor running/stopped states. Default false.
Changed
Improvements have been made to the system that apply when Charts and Reports are downloaded as Word files. Testing to word document generation in the renderer has been added and improvements have been made to the code in the dashboard.
Description
The following css classes have been removed from the Dashboard->Configuration, Themes, Style section as they are not used by the system:
pi-style__pdf-chart-heading
pi-style_login-screenpanel_button
.pi-stylebtn-primary:active, .pi-stylebtn-primary.active, .open .pi-stylebtn-primary.btn-primary, .pi-stylebtn-primary:active:hover, .pi-style__btn-primary:active:focus
.pi-stylebtn-primary[disabled]:active, .pi-stylebtn-primary[disabled].active, .open .pi-style__btn-primary.btn-primary[disabled]
.pi-stylebtn-default:active, .pi-stylebtn-default.active, .open .pi-stylebtn-default.btn-default, .pi-stylebtn-default:active:hover, .pi-style__btn-default:active:focus
.pi-stylebtn-default[disabled]:active, .pi-stylebtn-default[disabled].active, .open .pi-style__btn-default.btn-default[disabled]
.pi-stylebtn-danger:active, .pi-stylebtn-danger.active, .open .pi-stylebtn-danger.btn-danger, .pi-stylebtn-danger:active:hover, .pi-style__btn-danger:active:focus
.pi-stylebtn-danger[disabled]:active, .pi-stylebtn-danger[disabled].active, .open .pi-style__btn-danger.btn-danger[disabled]
.pi-stylebtn-warning:active, .pi-stylebtn-warning.active, .open .pi-stylebtn-warning.btn-warning, .pi-stylebtn-warning:active:hover, .pi-style__btn-warning:active:focus
.pi-stylebtn-warning[disabled]:active, .pi-stylebtn-warning[disabled].active, .open .pi-style__btn-warning.btn-warning[disabled]
Description
As part of the Merged Chart implementation we needed to refactor our Data Labels, as a result of this we’ve made them consistent with the current tooltips.
Fixed
Description
Corrected API documentation about response of listing items. For example, the response of GET /categories previously displayed an object e.g. {id: 0}. Now it shows a list of objects [{id: 0}]
Description
Timezone support has been added for MariaDB. The configuration tool CLI can be used to insert timezone tables to the MariaDB dashboard database and to change the timezone used by the database.
| Info |
|---|
The default timezone that the database uses is the same as the system timezone. |
Description
Trend lines were not being displayed in the correct colour when used on a chart. This issue has been fixed in this release and a trend line will now appear in the same colour that has been defined on the chart.
Video
We’ve created a short video to explain Trend Line Colours in a bit more detail.
| Confluence youtube macro video | ||||
|---|---|---|---|---|
|
Description
The Chart Tools button is now able to be individually styled through themes. The dashboard CSS styles selector is .pi-style__chart-panel .pi-style__chart-panel__chart-tools-button. Please see the Dashboard->Configuration, Themes, Style section for more information on CSS styles.
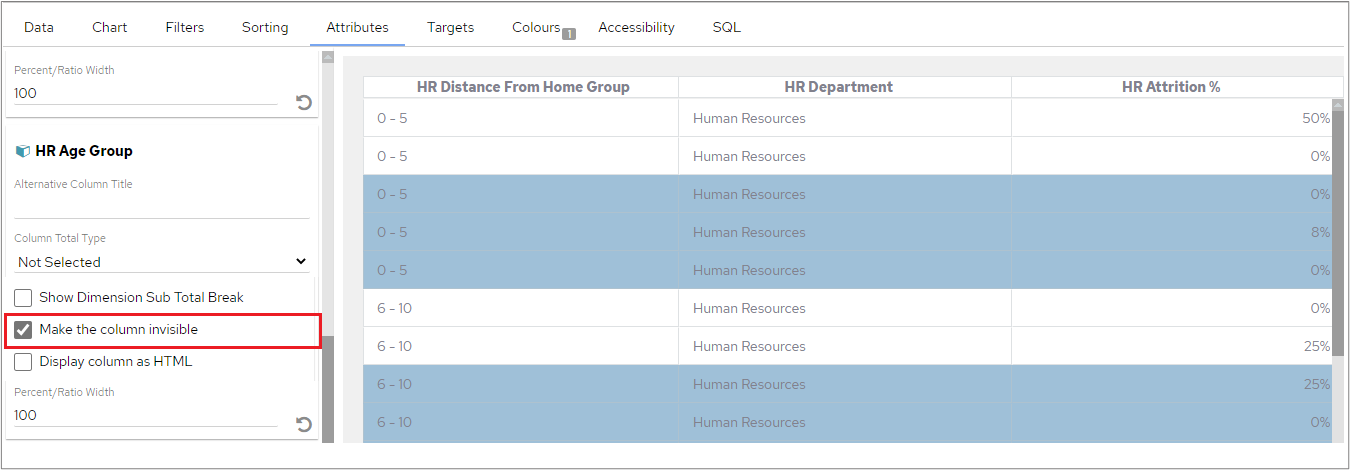
Problem
When the option ‘Apply colour to whole row’ was ticked on the Colours tab in the Edit, Chart screen and the selected column hidden, in the example below the HR Age Group column, the colour would not appear on the remaining columns in the table.
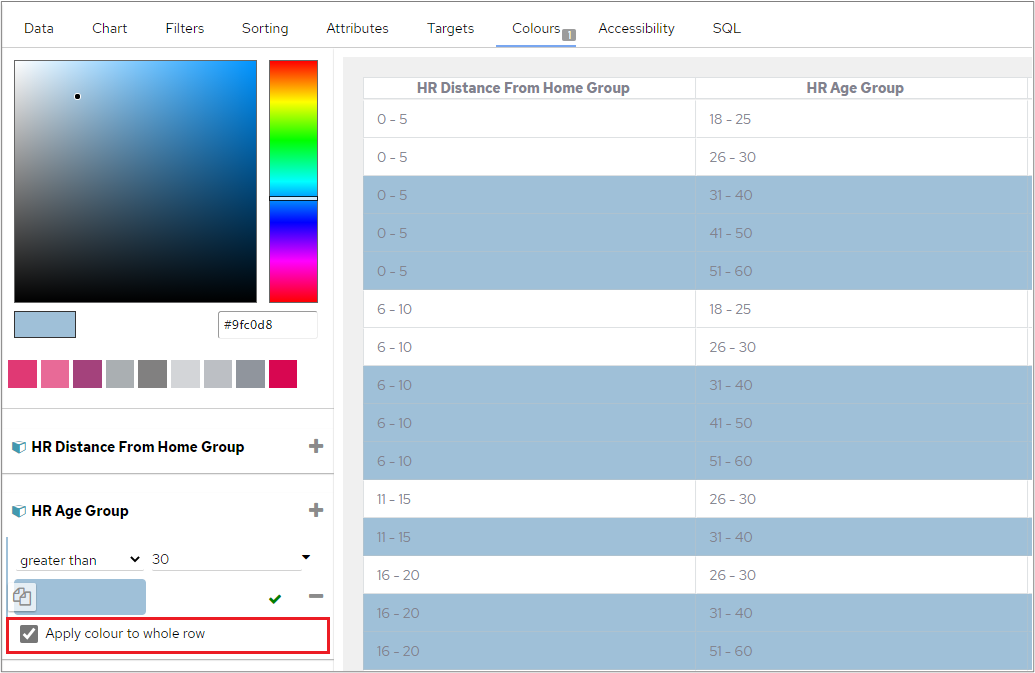
Solution
This has been fixed in this release and now when the related column is hidden, the row colour will still be visible on the remaining columns.
Description
If users already had a current dashboard licence, this was not showing in the configuration-tool GUI. This issue has been fixed in the March 2021 release and the ‘Licence’ tab on the configuration tool now shows the correct path to an installed licence along with the licence information.
Keeping An Eye On pi
| Info |
|---|
|


