| Excerpt | ||||
|---|---|---|---|---|
You can quickly modify the way the dashboard is presented to users. The first change you may want to make is to replace a chart in a cell with a different chart. To do this, we can select a different chart from the Chart Library. Let’s look at an existing category.  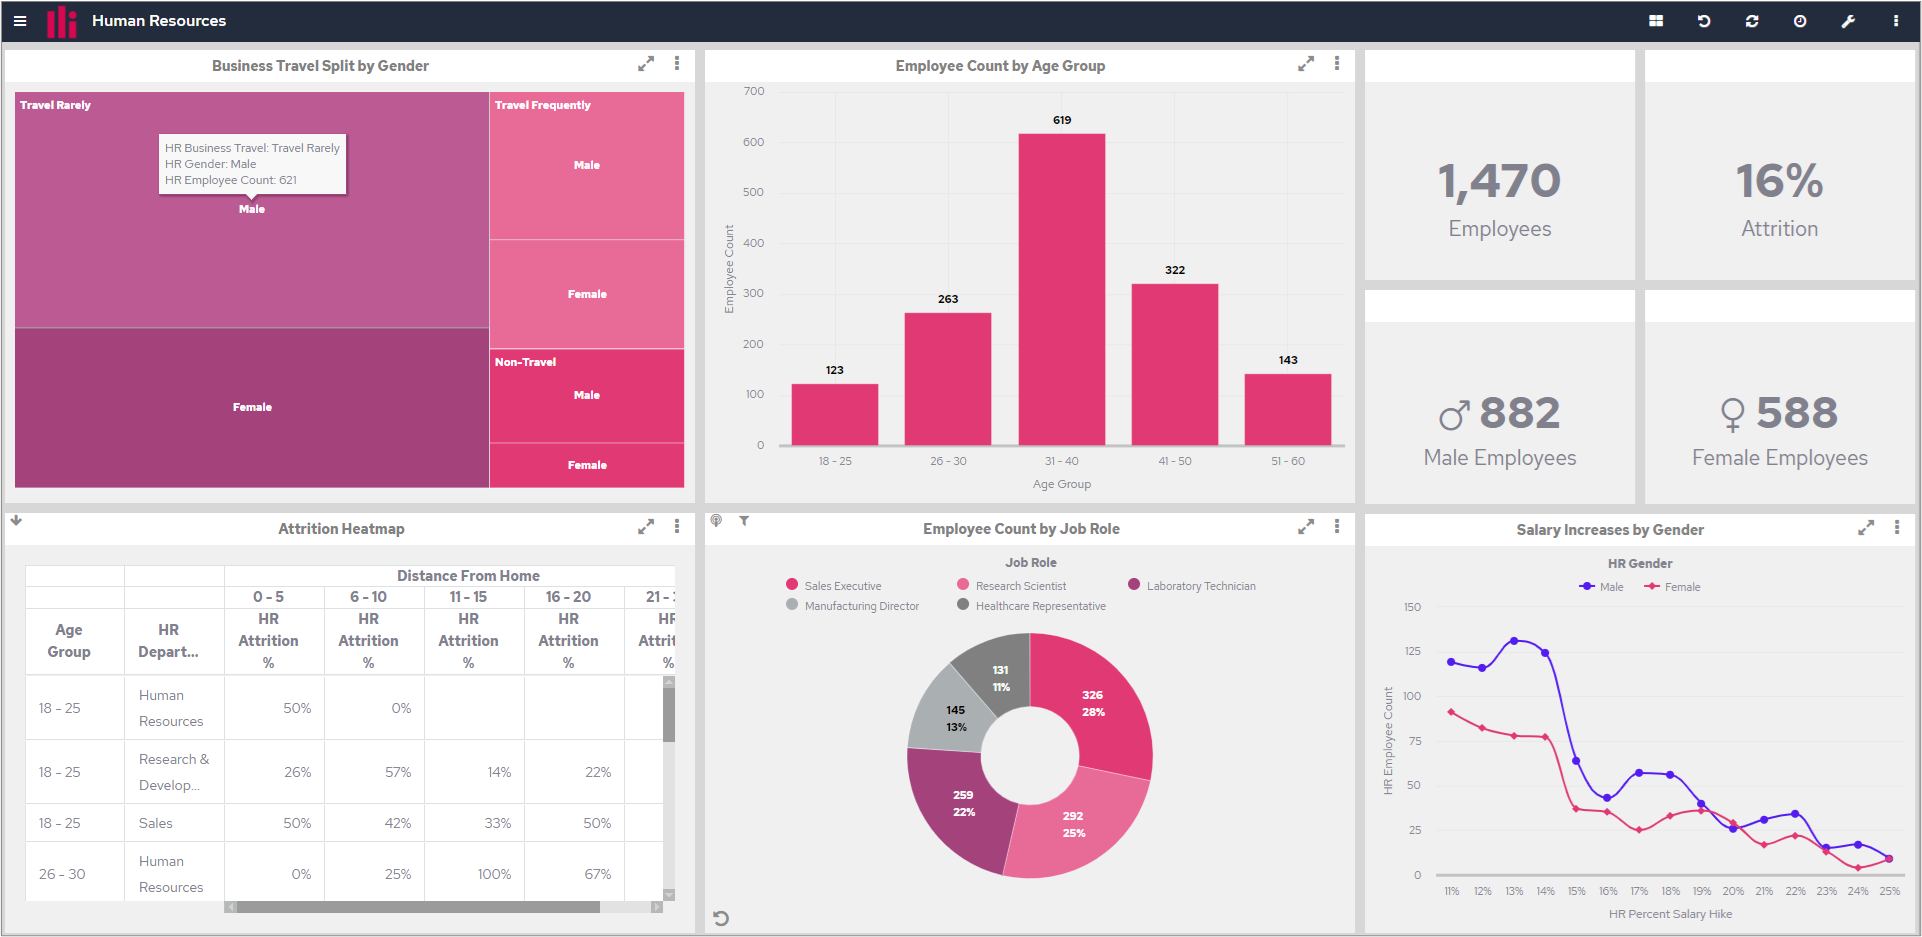 To swap the bar chart displayed on the top row, open the tools menu on the chart cell by clicking the ‘Chart Tools’ icon in the top-right corner of the cell.  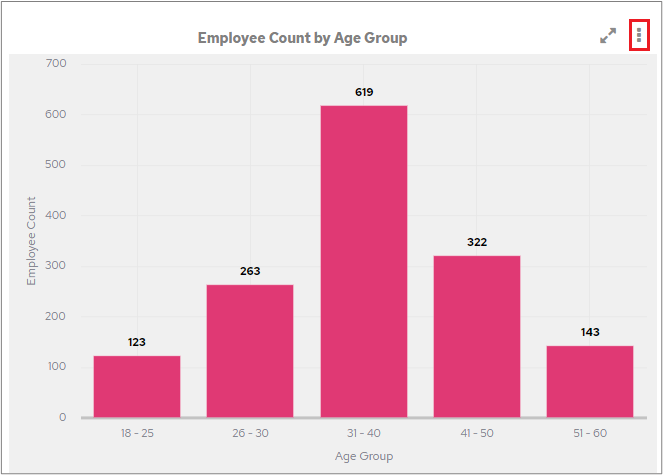 Then select the Chart Library button from the Tools menu.  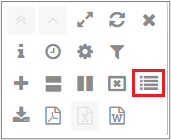 The Chart Library list will appear. This will show a list of all the charts you have access to; with charts grouped by the categories they belong to.  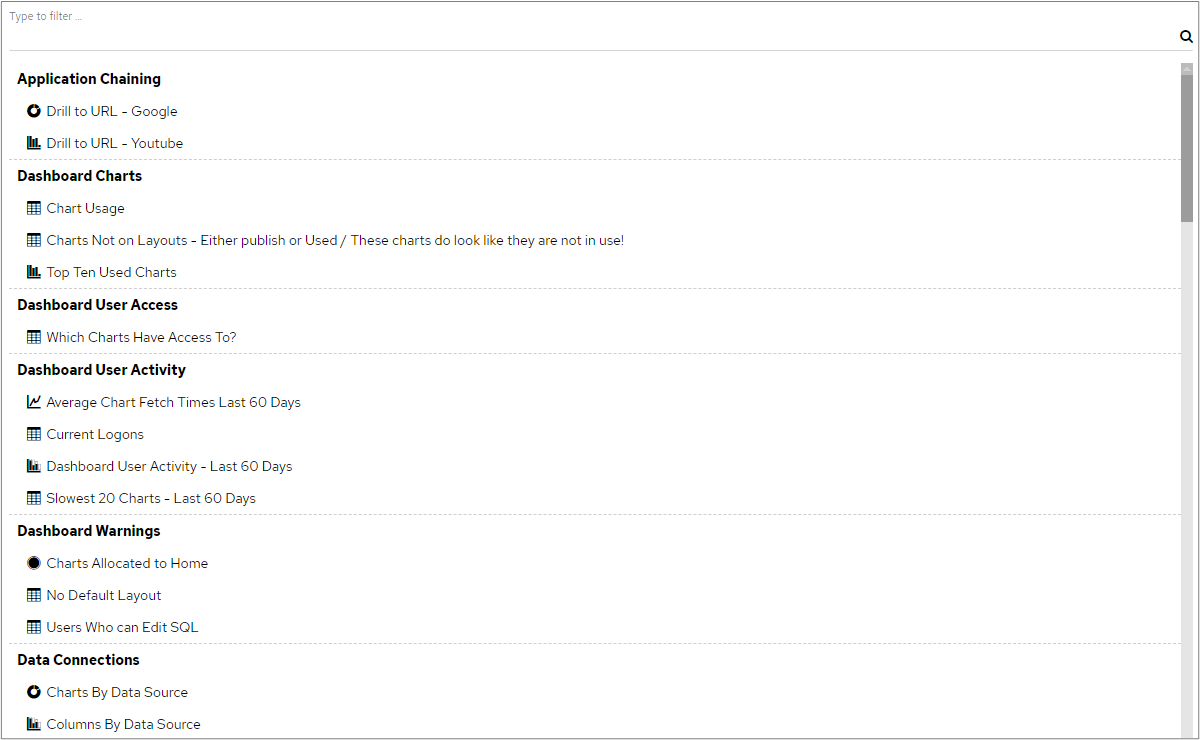
To replace the current chart with the one in the library click it in the library list and the existing chart will be replaced. This doesn’t delete or change the functionality of the previous chart; you are simply changing what you see in your layout.
|
...