We are pleased to present our latest offering of pi - our July 2021 release! This page helps summarise and familiarise you with the changes we have made, and is supported (where applicable) with useful videos to help explain the changes we have delivered.
| Note |
|---|
- in response to a Java security vulnerability around Log4J2, this version of the dashboard needs to be updated to a version from our patched November 21 (inclusive) - or mitigating actions taken to provide security assurances - more information can be found HERE |
| Info |
|---|
25/08/2021 - a patch release has been made available for the July 2021 release. This patch relates to an issue with the dashboard not closing connections to the databases when a query fails. You can find the latest version (2021-07-29.3) by clicking the Download It Now link. |
| Info |
|---|
04/08/2021 - a patch release has been made available for the July 2021 release. This patch relates to the cumulation issue. If you use jConnect, JTDS and Snowflake JDBC connectors please upgrade to this version as soon as possible. You can find the latest version (2021-07-29.1) by clicking the Download It Now link. |
| Info |
|---|
Before upgrading, we recommend taking a backup. You can find more information here. |
Here’s what we’ll cover;
| Table of Contents |
|---|
Added
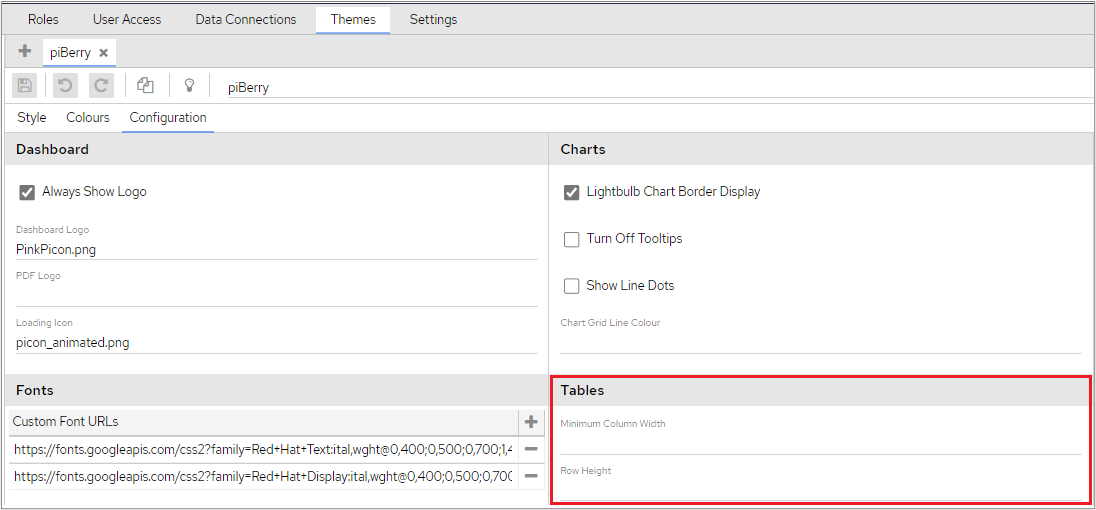
In Dashboard Configuration>Themes>Configuration a minimum Column Width and fixed Row Height has been added under the new heading ‘Tables’. These settings will apply to all table type charts (Table, Rotated Table and Editable Table) using the selected theme on the dashboard.
Adding a numerical value to ‘Minimum Column Width’ field will restrict all table columns so that they don’t fall below the specified width. This value will be respected even if width values have been applied to individual columns in the Edit Chart screen.
Adding a numerical value to ‘Row Height’ will fix the height of all table body rows to the specified height. Setting this value will also overwrite line-height in .pi-style__table-body-cell, to use this property the !important tag needs to be added to line-height in .pi-style__table-body-cell.
| Info |
|---|
Row height does not apply to header rows, which can already be adjusted in the tables styles tab with |
Video
We’ve created a short video to explain this in a bit more detail.
| Confluence youtube macro video | ||||
|---|---|---|---|---|
|
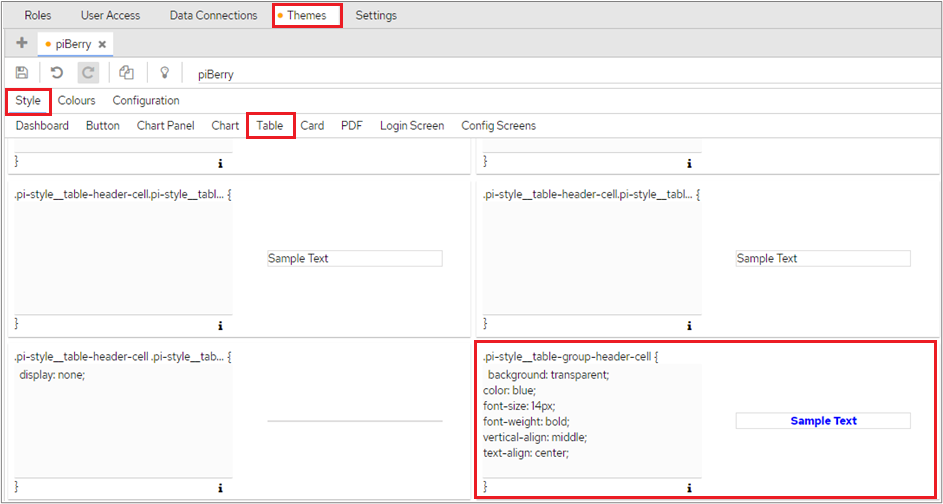
An option has been added that will provide users with the ability to style the Group Headers used in Crosstab tables. This will make it easier to distinguish between the different headers used. Group Headers can be styled using Dashboard Configuration > Themes > Style and then selecting the ‘Table’ tab.
Styles can be applied to the entire Group Header or alternatively, you can style headers that contain dates, numbers, text or null values separately using one of the other options available on the Themes>Styles>Tables tab. Please refer to the supporting documentation for more information.
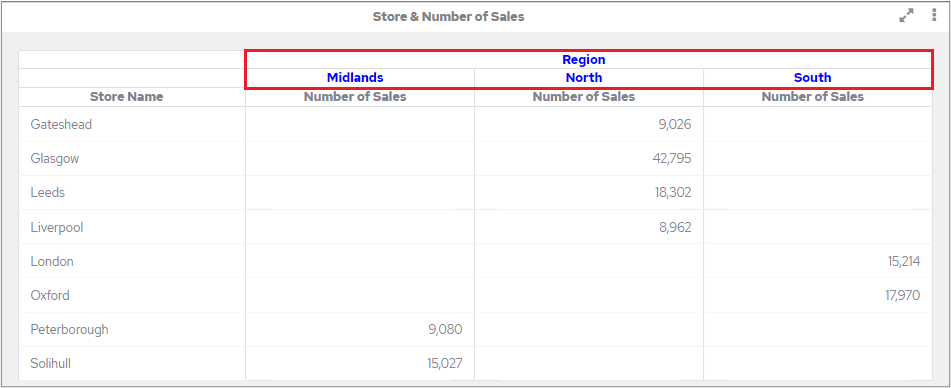
This is how the change made in the screenshot above would look on a table.
Video
We’ve created a short video to explain this in a bit more detail.
| Confluence youtube macro video | ||||
|---|---|---|---|---|
|
Network graph is a mathematical graph that shows relationships between points. The graph visualizes how subjects are interconnected with each other. Entities are displayed as nodes and the relationship between them is displayed as lines. The Network Graph has various uses such as to display relationships between people, companies, and products.
Screenshots
There is the option on the Network graph to display data in two different ways - grouped by Node or grouped by the State. The following example shows grouping by Node.
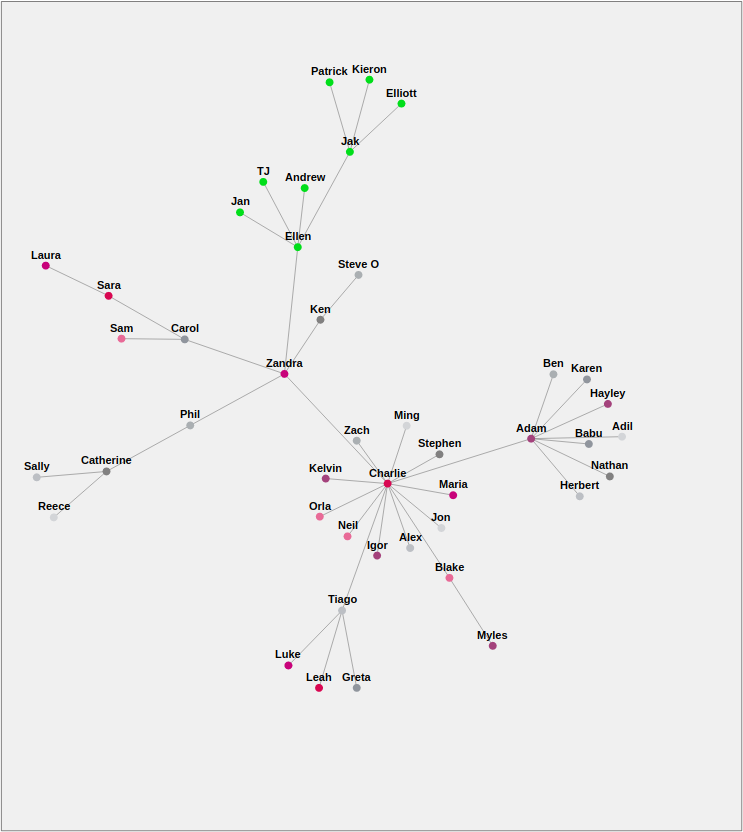
Please refer to the related documentation for more information.
Video
We’ve created a short video to explain this in a bit more detail.
| Confluence youtube macro video | ||||
|---|---|---|---|---|
|
A new chart type has been introduced which will allow users to combine up to 3 separate tables into one merged table, this feature works in a similar way to Merged Charts. Create and customise each table separately and when these tables are merged the Merged Table will inherit the individual features of the separate tables.
Screenshots
The following screenshots shows the result of a Crosstab table merged with a simple data table. Colouring has been added to each of the child tables and this has also been combined into the Merged table.
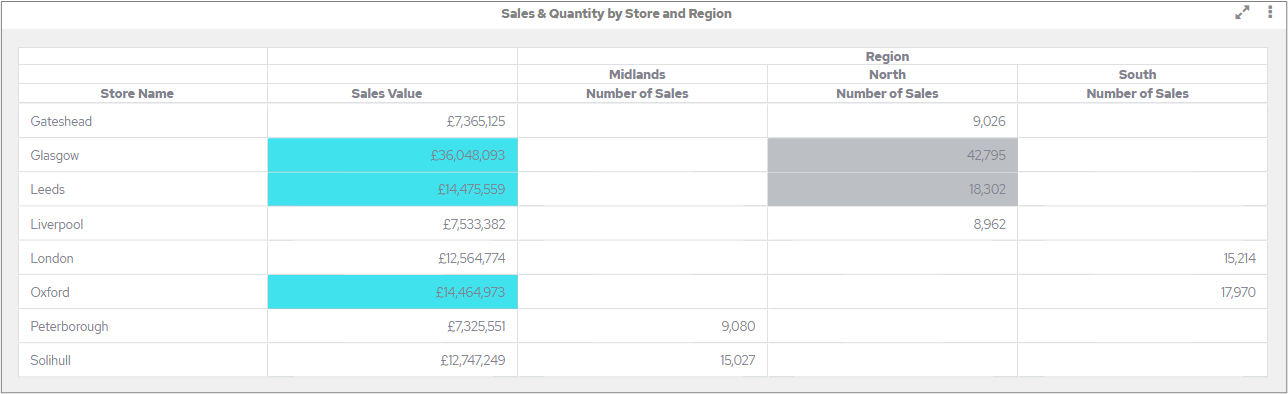
Please refer to the related documentation for more information.
Video
We’ve created a short video to explain this in a bit more detail.
| Confluence youtube macro video | ||||
|---|---|---|---|---|
|
New API endpoints have been added to allow for downloading charts. This works in the same way as clicking one of the download options in the Chart Tools menu on the dashboard.
If a user has the relevant permissions to download a chart in the dashboard, this user can also download the chart in the same format using the API.
The API returns the chart data content in text, so using the API to download a chart generally requires writing code to create the file with the data content.
| Info |
|---|
You will be able to download charts as an Image, PDF, CSV, Word or PowerPoint file. |
You can find more information in our API documentation.
Video
We’ve created a short video to explain this in a bit more detail.
| Confluence youtube macro video | ||||
|---|---|---|---|---|
|
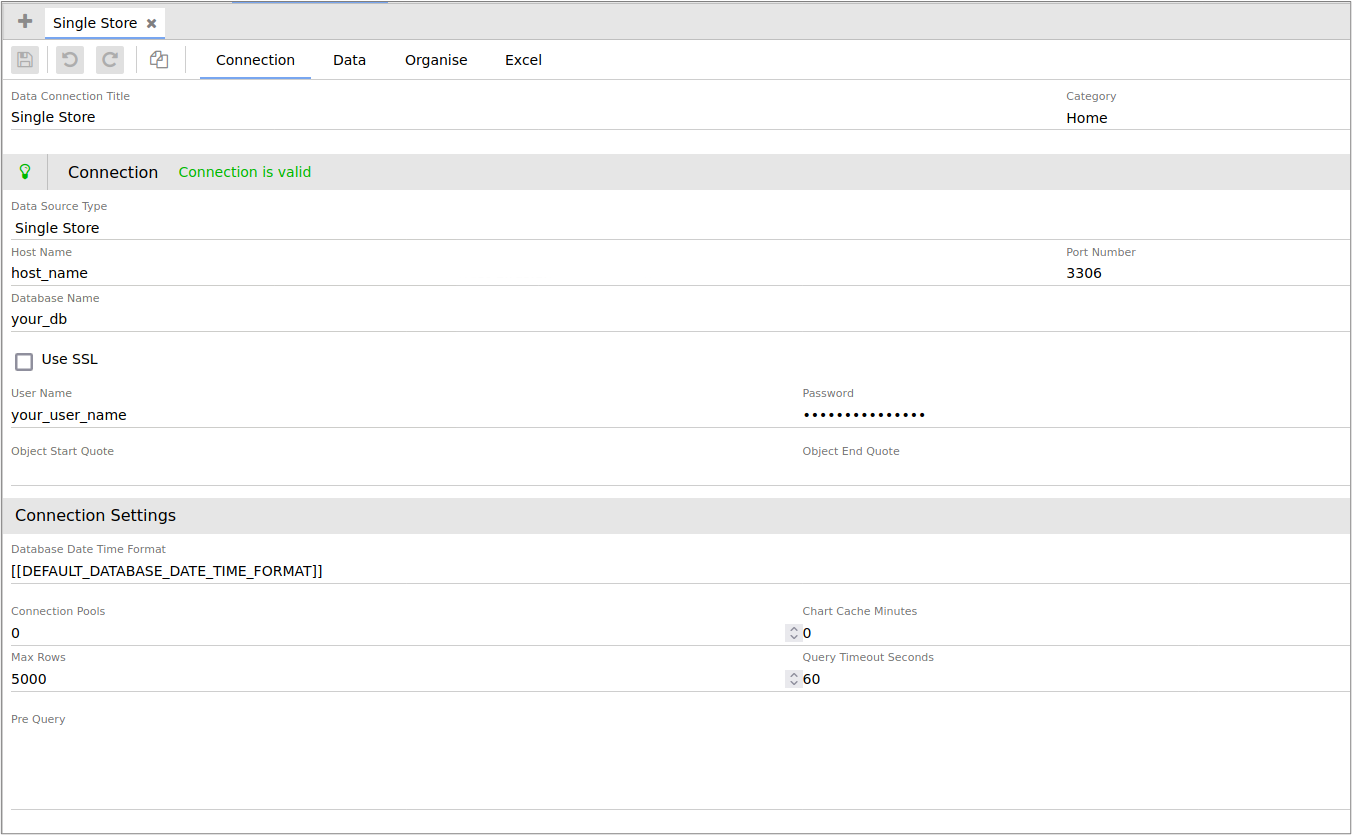
A new Data Connection, SingleStore is now available. Please refer to the related documentation for more information.
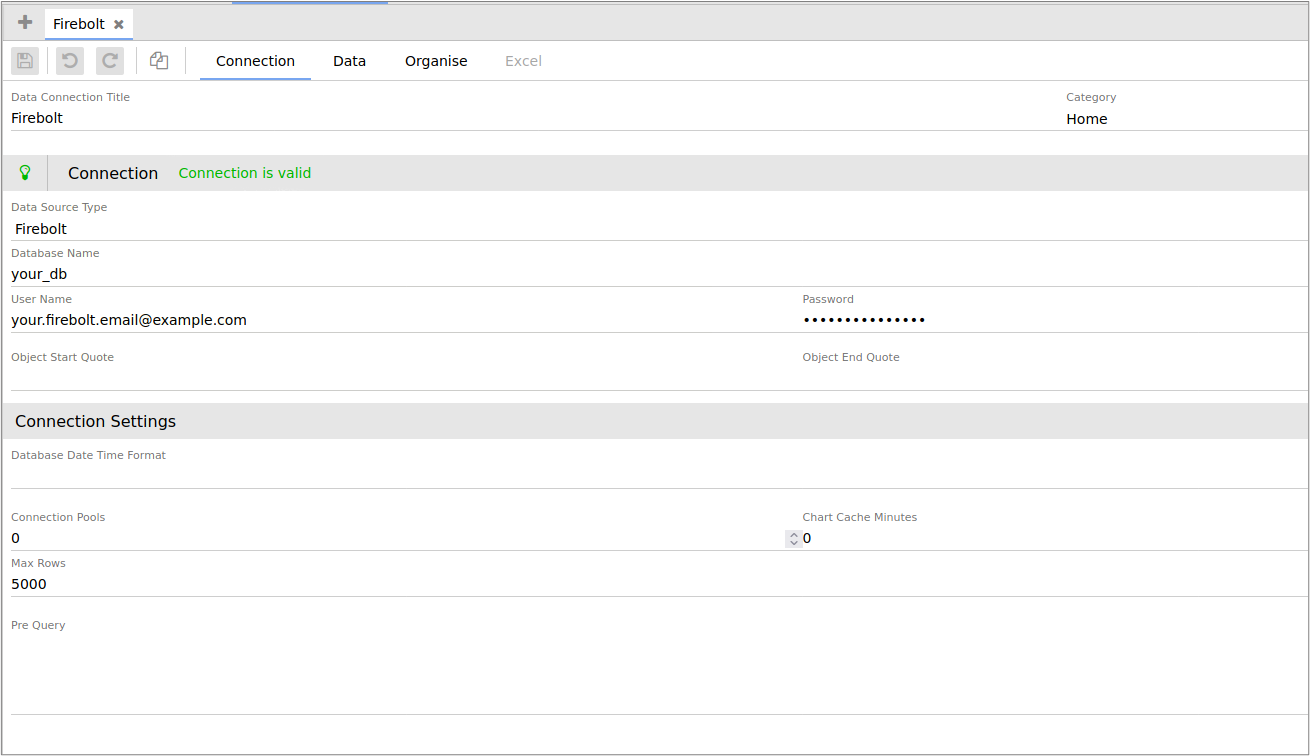
A new Data Connection, Firebolt is now available.
Changed
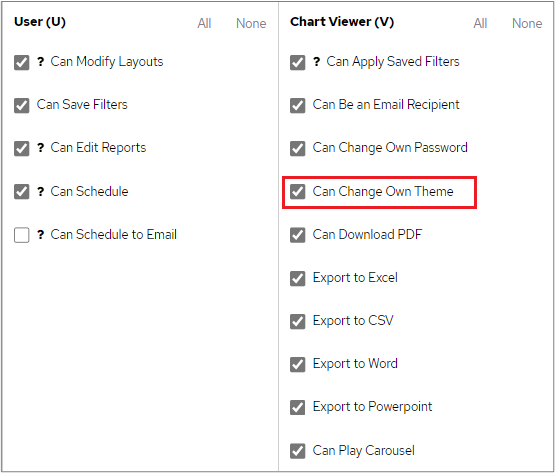
The name for the ‘Can Edit Own Theme’ permission has been changed to ‘Can Change Own Theme’ to avoid confusion.
Video
We’ve created a short video to explain this in a bit more detail.
| Confluence youtube macro video | ||||
|---|---|---|---|---|
|
The API Embed Example application has been updated to the v2 API. You can find more information here.
Video
We’ve created a short video to explain this in a bit more detail.
| Confluence youtube macro video | ||||
|---|---|---|---|---|
|
Fixed
When using text/colour containers in pi Reports the result was not respecting the correct row height set by the user.
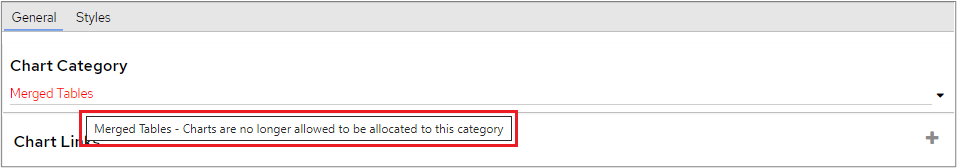
If users try to duplicate which is assigned to a Category that can no longer allocate charts a warning message will be displayed. The duplicate chart will be assigned to the first category which can allocate charts.
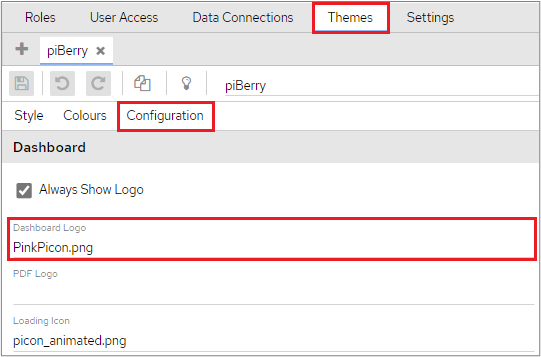
When a logo has not been added to Themes>Configuration> Dashboard Logo and/ or a Theme has not been selected, the new Panintelligence logo will be the default logo.
Reports were not downloading when a local image path had been used in the report header.
Large reports were being downloaded as corrupted files due to the Renderer timing out.
When using tables on pi Reports the result would have large height headers not representing the correct size of the table header.
Rows spreading over multiple pages when the Hide Text (Hide chart title) option is set to true will no longer happen.
The PDF document will now include the correct size of the chart together with margins, padding and correct positioning of help text. The chart will also take up the whole page and will follow the same style rules as other chart types when downloaded as PDF.
Stacked Bar charts containing a lot of data on the X Axis, a specified AVG Target and enabled Data Labels were not rendering correctly.
When using the API v2 and POSTing or PUTing to the /users/ endpoint, the user was not being created when the lite property was not declared as true or false.
An error message will no longer be displayed when using the password reset function.
When an object is defined as a number with cumulation as Cumulative or Decumulative, the data was being concatenated as a string instead of being summed. This was affecting data objects when using jConnect, JTDS and Snowflake JDBC connectors. A July 2021 patch has been released to address this issue.
| Info |
|---|
If you use jConnect, JTDS and Snowflake JDBC connectors, please ensure you download and install the July 2021 patch. |
Backing up and restoring the dashboard database (repository) is no longer permitted on a newly installed or upgraded, never run dashboard. It must be configured using the configuration tool first. As part of this fix the configuration-tool creates a file in the dashboard root folder called configured.txt, this file contains the date when a configuration was last applied to the dashboard. This date is displayed at the top of every page in the configuration-tool-GUI application.
Keeping An Eye On pi
| Info |
|---|
|


