With effect from 2022-03-31 dashboard release:
Sub-query will enable users to introduce charts as filter values, this means that charts are run as sub-queries which will help build the data of the main chart.
Please refer to this page to see a walkthrough of a sub-query filter.
when using an in/not in operator - the first column of the data from the sub-chart is used (multiple values, as described on the tooltip in the screenshot)
top/bottom operator - when using a top/ bottom operator, the option to select a chart to filter on will not be available
single value operator e.g. Like - the first data point (first row of the first column) is used as the filter value
After selecting what you want to filter on and the operator you want to use you will then be able to select from data or a chart when picking the value to filter on. The type of charts allowed to be used as sub-query are similar to the options that you can select from when using merged charts/ tables. If a chart can be used as a sub-chart of a merged chart or table, it can be used as sub-query. This means that
lines, bars, tables are allowed
pies, special shapes, maps, merged charts/tables and so on can not be used
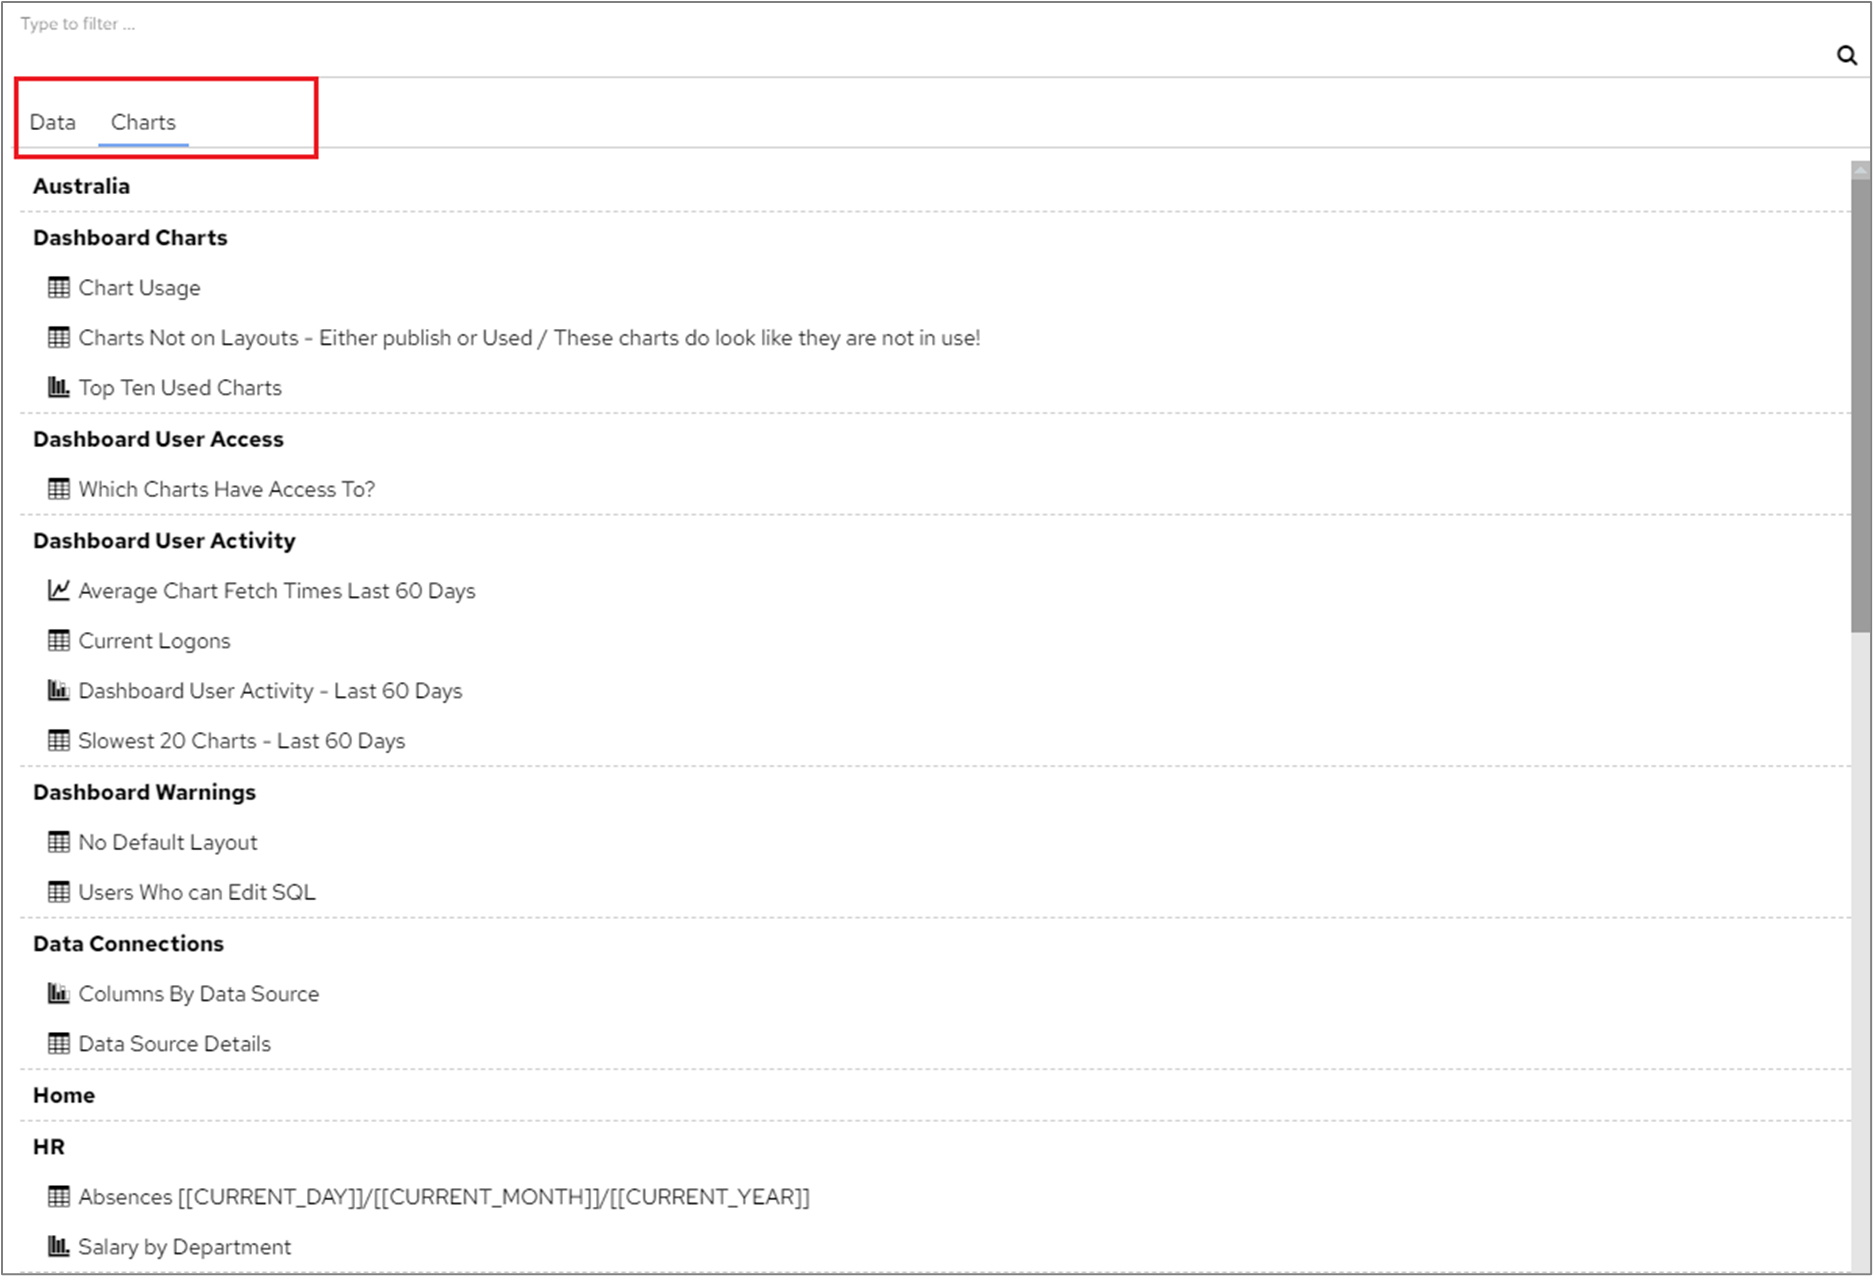
The ‘Type to filter’ screen has now been split into two sections - Data and Charts. The Data screen is used in the same way as it was previously (please see this page for more information).
The screenshot below shows the chart types that can be selected from. If a chart type can not be used in a sub-query it will not be available on the' Charts' screen under ‘Type to filter’.

By using Sub-query, you will be able to:
use sub-chart data from another data connection, e.g. in the following example.
chart 1 is from a Sales data connection
chart 2 is from a HR data connection
chart 1 can be filtered using chart 2
this means you could view the sales related to employees who take a lot of holidays
use sub-chart data from another chart, which is built with complex sql query structure
Since sub-query charts are building charts to be used by other charts, the time it takes to display a chart will be the total time it takes to build all the charts used. You can see a breakdown of these times by clicking Chart Tools>Chart Information and selecting the ‘Debug’ tab.

In this example, the total time to build all charts is 748ms. This includes the 309ms taken to build the sub-query chart.

To reduce the length of time taken to draw your chart, try to avoid using lots of sub-query references in your charts. |
Cycle referencing: If Chart 1 uses Chart 2, Chart 2 uses Chart 3, Chart 3 uses either Chart 1 or Chart 2 as sub-query, the system shows an error
Sub-charts are changed: If a sub-chart is edited afterwards, you may get unexpected results on the main chart while the main chart is not likely to be broken, because the main chart simply just picks the first column or first data point of the sub-charts, it doesn’t care how the sub-charts are configured
Sub-charts not having data: again, the main chart is not likely to display data since there isn’t anything relevant