
We are pleased to present our latest offering of pi - our June 2021 release! This page helps summarise and familiarise you with the changes we have made, and is supported (where applicable) with useful videos to help explain the changes we have delivered.
| Note |
|---|
- in response to a Java security vulnerability around Log4J2, this version of the dashboard needs to be updated to a version from our patched November 21 (inclusive) - or mitigating actions taken to provide security assurances - more information can be found HERE |
| Info |
|---|
09/07/2021 - a patch release has been made available for the June 2021 release. This patch addresses an API fix and an issue with embedding which was causing large logs. You can find the latest version (2021-06-24.1) by clicking the Download It Now link. |
| Info |
|---|
Before upgrading, we recommend taking a backup. You can find more information here. |
Here’s what we’ll cover;
| Table of Contents |
|---|
Added
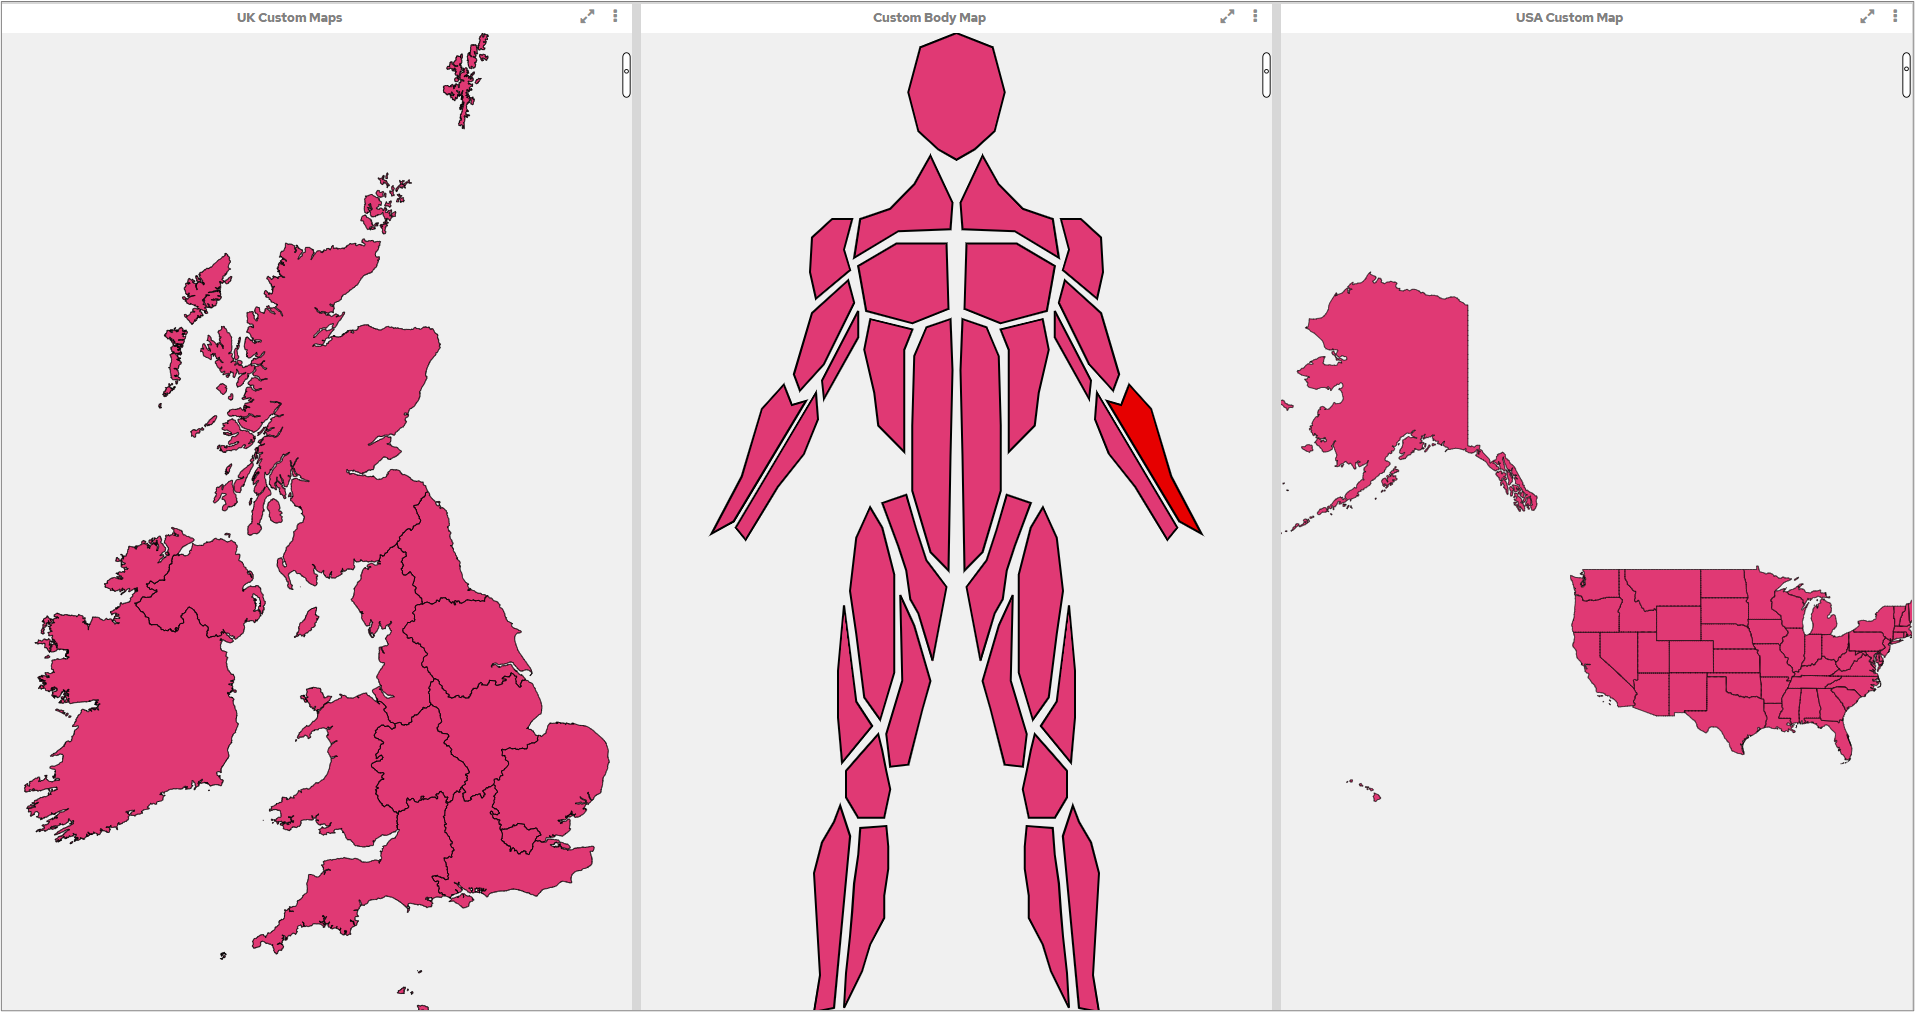
Custom Maps has been added as a Chart Type. Custom Maps enable data to be mapped over an SVG, plotting sections of the SVG based upon an identifier. The sections can be defined by the user.
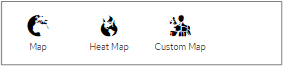
The Custom Map type is available in the chart editor.
In order to use this map type, an SVG, Mapper ID, identifier, label and detail are required.
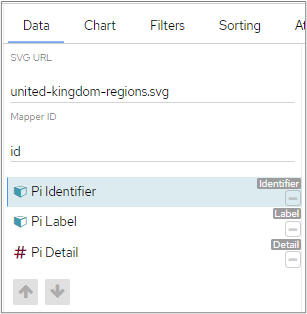
You can find more information about Custom Maps here.
Screenshots
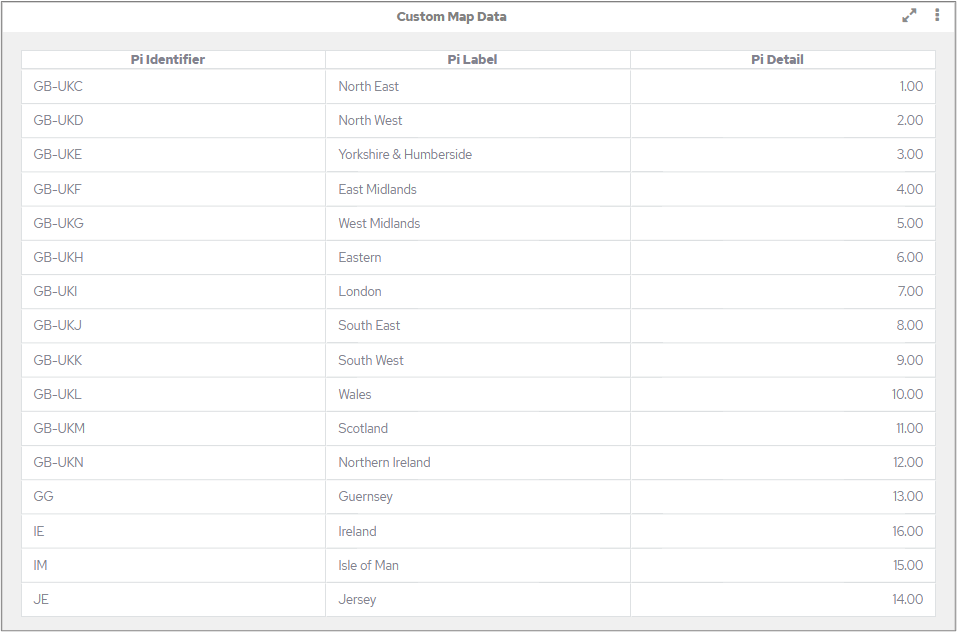
This table provides an example of the data used to draw a Custom Map.
The following screenshot shows examples of 3 different Custom Maps.
Video
We’ve created a short video to explain this in a bit more detail.
| Confluence youtube macro video | ||||
|---|---|---|---|---|
|
| Info |
|---|
Please also refer to Known Issues for details regarding exporting Custom Maps. |
We have added a postMessage API to allow the Dashboard interface to be securely controlled when embedded. Click here for general information on this functionality.
The current functionality is:
Open/close left-drawer (category list) and right-drawer (category object list)
Pin/unpin left-drawer and right-drawer
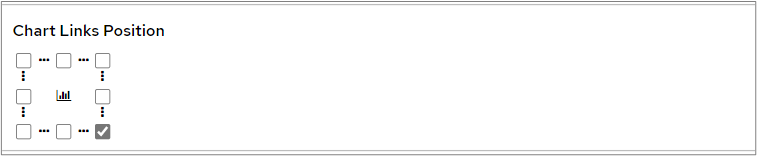
In the same way that you can choose the position of a Legend, users will now be able to choose where Link buttons are displayed in chart cells. By default, Link buttons will appear at the bottom right of a chart cell (for all chart types) but users will be able to change the position on the ‘Config’ screen after clicking the ‘Edit Chart’ icon.
| Info |
|---|
If there is a large number of link buttons, a vertical scroll bar will be created. This will happen when using the |
Please take a look at our documentation for more information.
Screenshots
The following screenshot shows Chart Link buttons in the Middle-Left position of the chart cell.

Video
We’ve created a short video to explain this in a bit more detail.
| Confluence youtube macro video | ||||
|---|---|---|---|---|
|
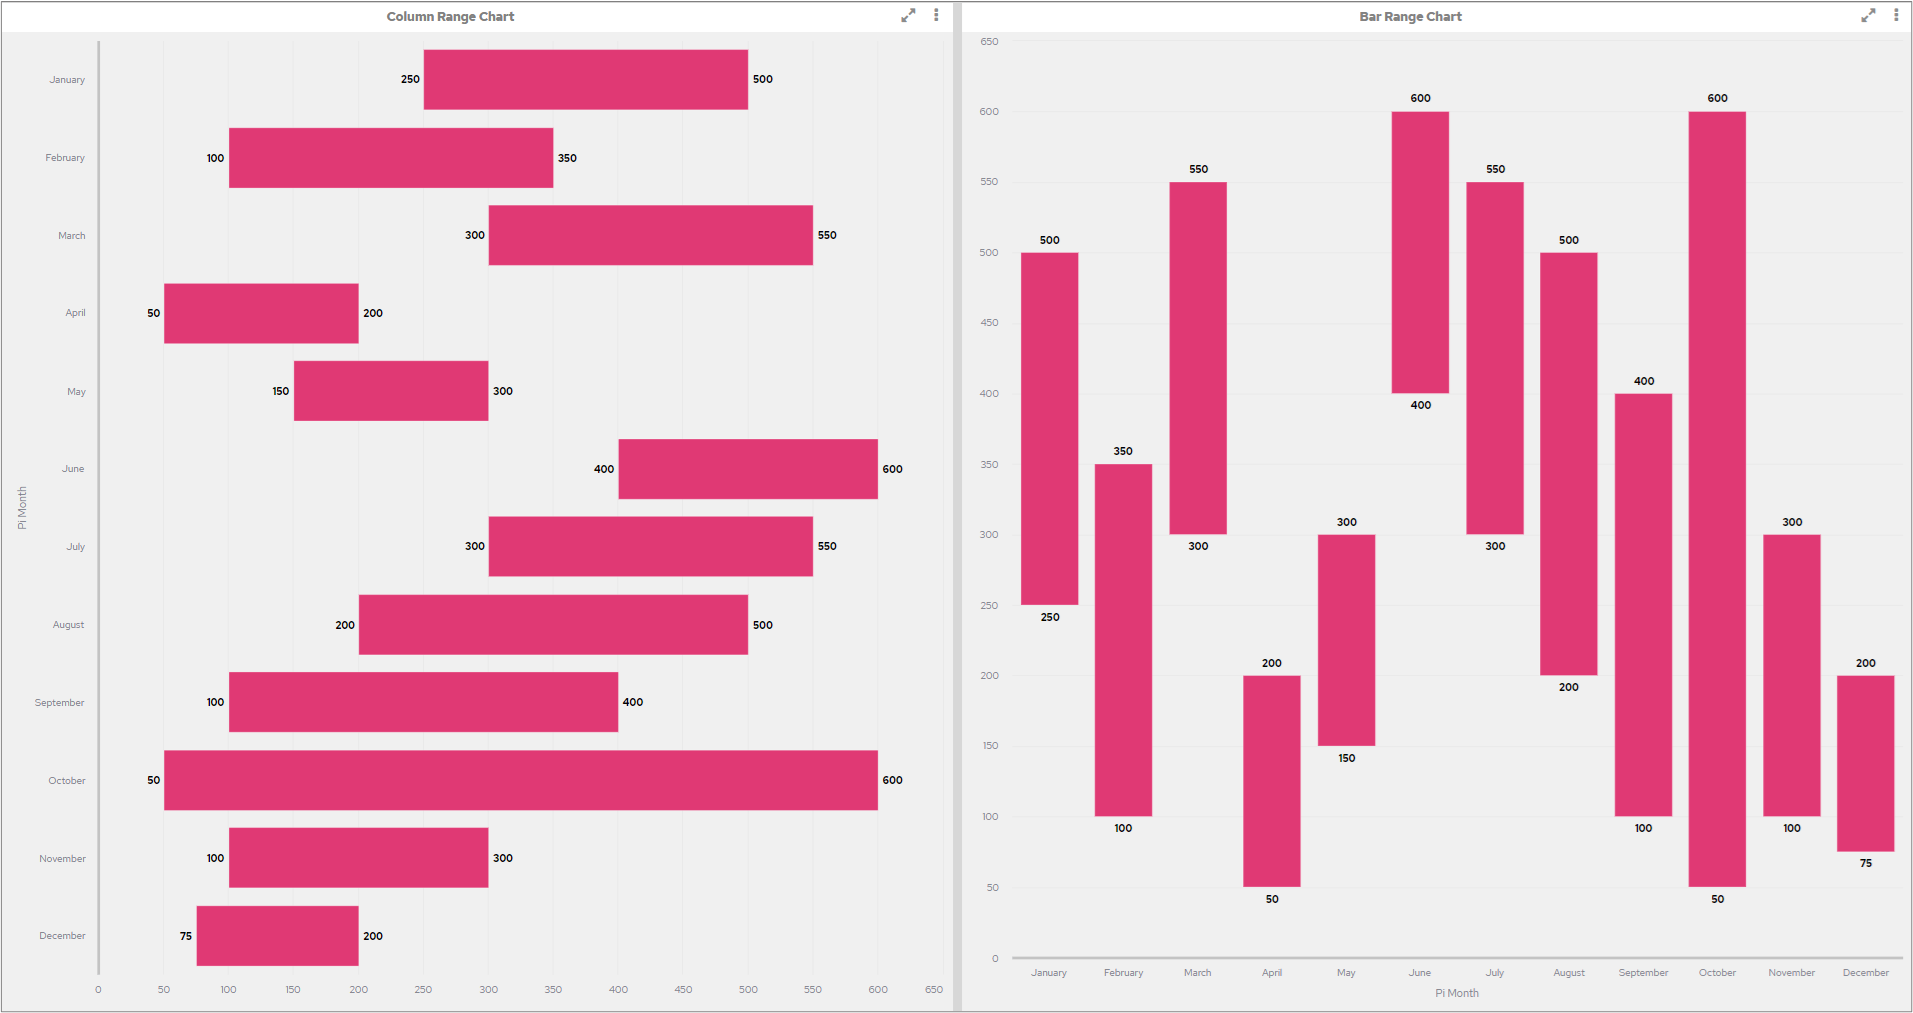
Column Range and Bar Range charts have been added as Chart Types. These charts can be used to represent high and low points with a bar between them.
Both the Column Range and Bar Range chart types are available in the chart editor.
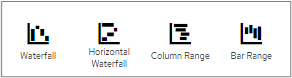
To use these chart types, an x-axis, high value and low value are required. You can find more information here.
Screenshots
Video
The following video explains more about Sankey Diagrams and Column and Bar Range chart types.
| Confluence youtube macro video | ||||
|---|---|---|---|---|
|
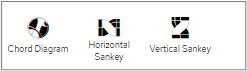
A Sankey Diagram is a great choice when you need to visualise data flow and volume between nodes. It’s very similar to a Chord Diagram in behaviour, to use this chart type you would need an Identifier, Nodes and States - all dimensions.
You’ll be able to select from two types of Sankey Chart - Horizontal and Vertical.
You can find more information here.
Screenshots

A new Data Connection has been introduced, Google Big Query.
To use this connection type, please read the the please read the ‘Google Documentation for Big Query licencing agreement’.
To enable Big Query connection type, a few things are needed:
Driver jar files: the driver (.jar files) needs to be copied into the
tomcat/custom_jdbc_driversfolder (on the dashboard installation server). The driver can be downloaded from here
| Info |
|---|
Use the JDBC 4.2 compatible download |
OAuth Service Account Email. This is the email address for your Google Service Account.
OAuth Private Key JSON file: this file contains your google service account details and private key. It is obtained from your Google Service Account where you are hosting the BigQuery Database. The file needs to be placed in the
tomcat/jdbc_custom_driversfolder, and the absolute path of the file on the server needs to be put into the connection setup screen.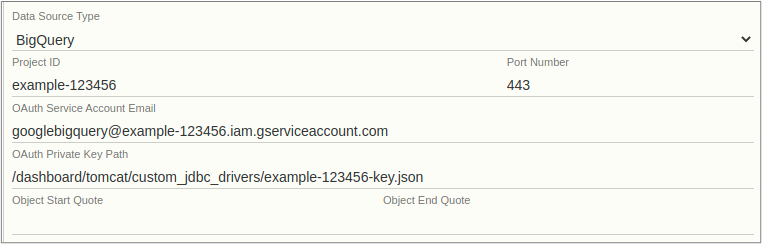
Video
We’ve created a short video to explain this in a bit more detail.
| Confluence youtube macro video | ||||
|---|---|---|---|---|
|
Added endpoints for exporting and importing data connections along with related items e.g. charts and categories.
Export: GET /api/v2/exportImportConnections/{id}
Import: POST /api/v2/exportImportConnections
Please refer to the API documentation for further details about these endpoints
| Info |
|---|
|
Using old exported content:
If you have content exported from a previous version of the dashboard, and you want to import to a newer dashboard, one way to do so is to let the dashboard upgrade the data:
Install an old clean dashboard (same version as the exported content - the version is on the exported content)
Import old content to the old dashboard
Upgrade the old dashboard to a new version
Export the same content from the upgraded dashboard
Import newly exported content to the target dashboard
The new selector on the chart editor configuration allows the user to select how empty data should be represented on the chart. By default, no conversion is selected but it can be changed into ‘Convert Nulls to Zeros’ or 'Convert Zeros to Nulls'. This means that you will be able to select whether blanks are displayed as 0 or the field is left blank.
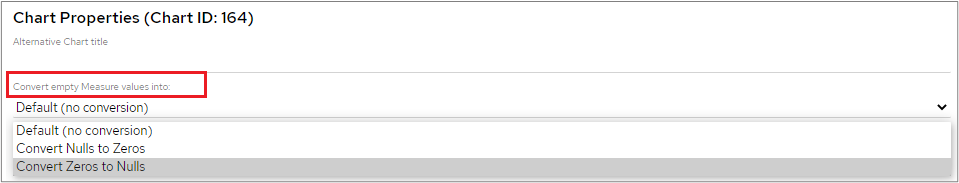
Please take a look at our documentation for more information.
Video
We’ve created a short video to explain this in a bit more detail.
| Confluence youtube macro video | ||||
|---|---|---|---|---|
|
This allows a user to force the display of the category objects if the category contains Category Objects when embedding.
<iframe src="https://{DASHBOARD URL}/pi/?categoryMode=3&enableDynamicFilterPanel=true#/dashboard-system/#/redirectToDefaultCategoryState/{CATEGORY ID}"></iframe>
After recently adding a fully up-to-date and modern API we’re now producing ‘slim’ builds. The slim build does not contain the legacy API and we recommend using it unless you still require the legacy API. In future releases the default mode will be the equivalent of slim.
Docker: use the slim tag eg: slim_2021_xx_xx
Windows: uncheck the option from the Components list in the installer
Linux: not yet available
| Info |
|---|
Please aim to migrate to the modern API as soon as possible. |
Changed
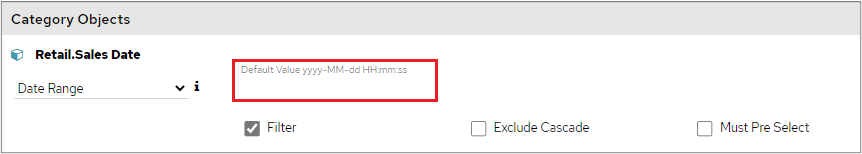
You will now be able to add free text in the ‘Default Value’ field for a Date Range Category Object.
Fixed
Colours can now be changed for different elements of an analytics type chart. Colours can be changed using the ‘Colours’ tab in the ‘Edit Chart’ menu. Please see this section for more information on changing colours.

When a theme that contained images in the ‘img’ folder was renamed in the dashboard, the contents of the ‘img’ folder were deleted. The ‘img’ folder will now not be affected if the theme is renamed in the dashboard.
When the Heat Map Chart Type was selected it was incorrectly displayed as the standard Map Chart Type. Heat Map Chart Types will now display as Heat Maps.
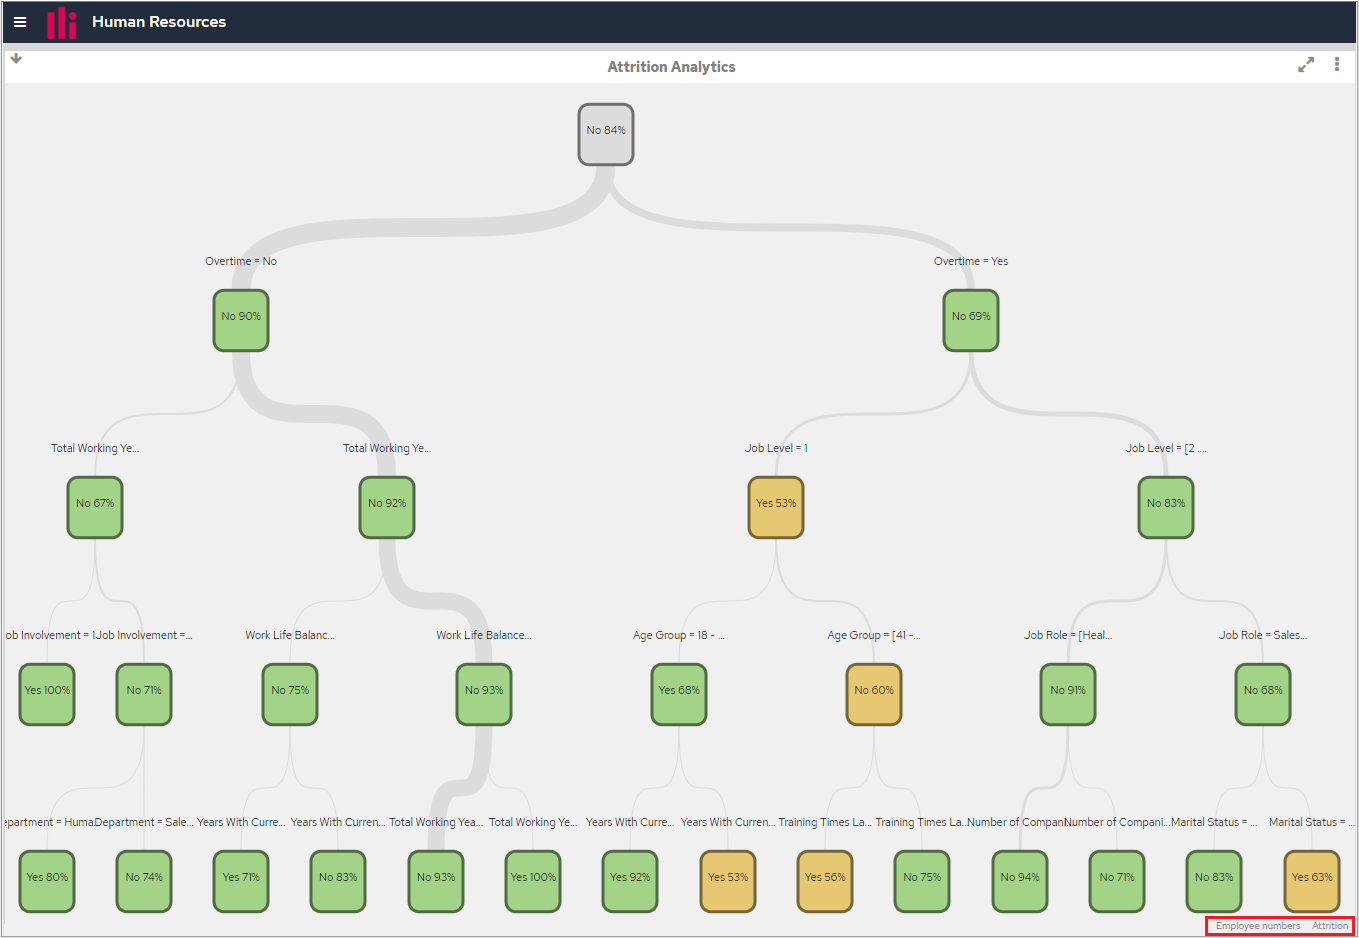
Link buttons are now displayed on an Analytic chart type in the same way as they are on other chart types.
When upgrading the dashboard, the HTTPS configuration was lost, this now no longer happens.
The dashboard was failing to start when the theme.json file was in the themes root folder.
A horizontal scroll was occasionally overlapping row totals when a scroll bar was not needed in the table.
Proxy and cookie settings were not migrating from the port selector to dashboard.json.
When the dashboard is installed from the same directory that contains the licence file the licence file will now be installed correctly.
The Dashboard could end up in a broken state if the Maria DB password change failed.
Known Issues
If you export Custom Map chart type as PDF, you will receive a PDF document with Custom Map displayed; however, the styling of the page is not correct, it possesses different margins and sizing in comparison with other chart type PDF exports. The help text is also positioned at the bottom. All other export types for Custom Maps (Word and PowerPoint) should work as expected.
| Info |
|---|
A fix for this issue will be available in the July release. |
Keeping An Eye On pi
| Info |
|---|
|


