We are pleased to present our latest offering of pi - our August 2021 release! This page helps summarise and familiarise you with the changes we have made, and is supported (where applicable) with useful videos to help explain the changes we have delivered.
- in response to a Java security vulnerability around Log4J2, this version of the dashboard needs to be updated to a version from our patched November 21 (inclusive) - or mitigating actions taken to provide security assurances - more information can be found HERE
22/09/2021 - a patch release has been made available for the August 2021 release. This patch relates to an issue with Excel exports (pi#417) and charts downloaded to PDF (pi#261), you can find further information in the Fixed section below. Download the latest version (2021-08-26.1) by clicking the Download It Now link above.
Before upgrading, we recommend taking a backup. You can find more information here.
Here’s what we’ll cover;
Added
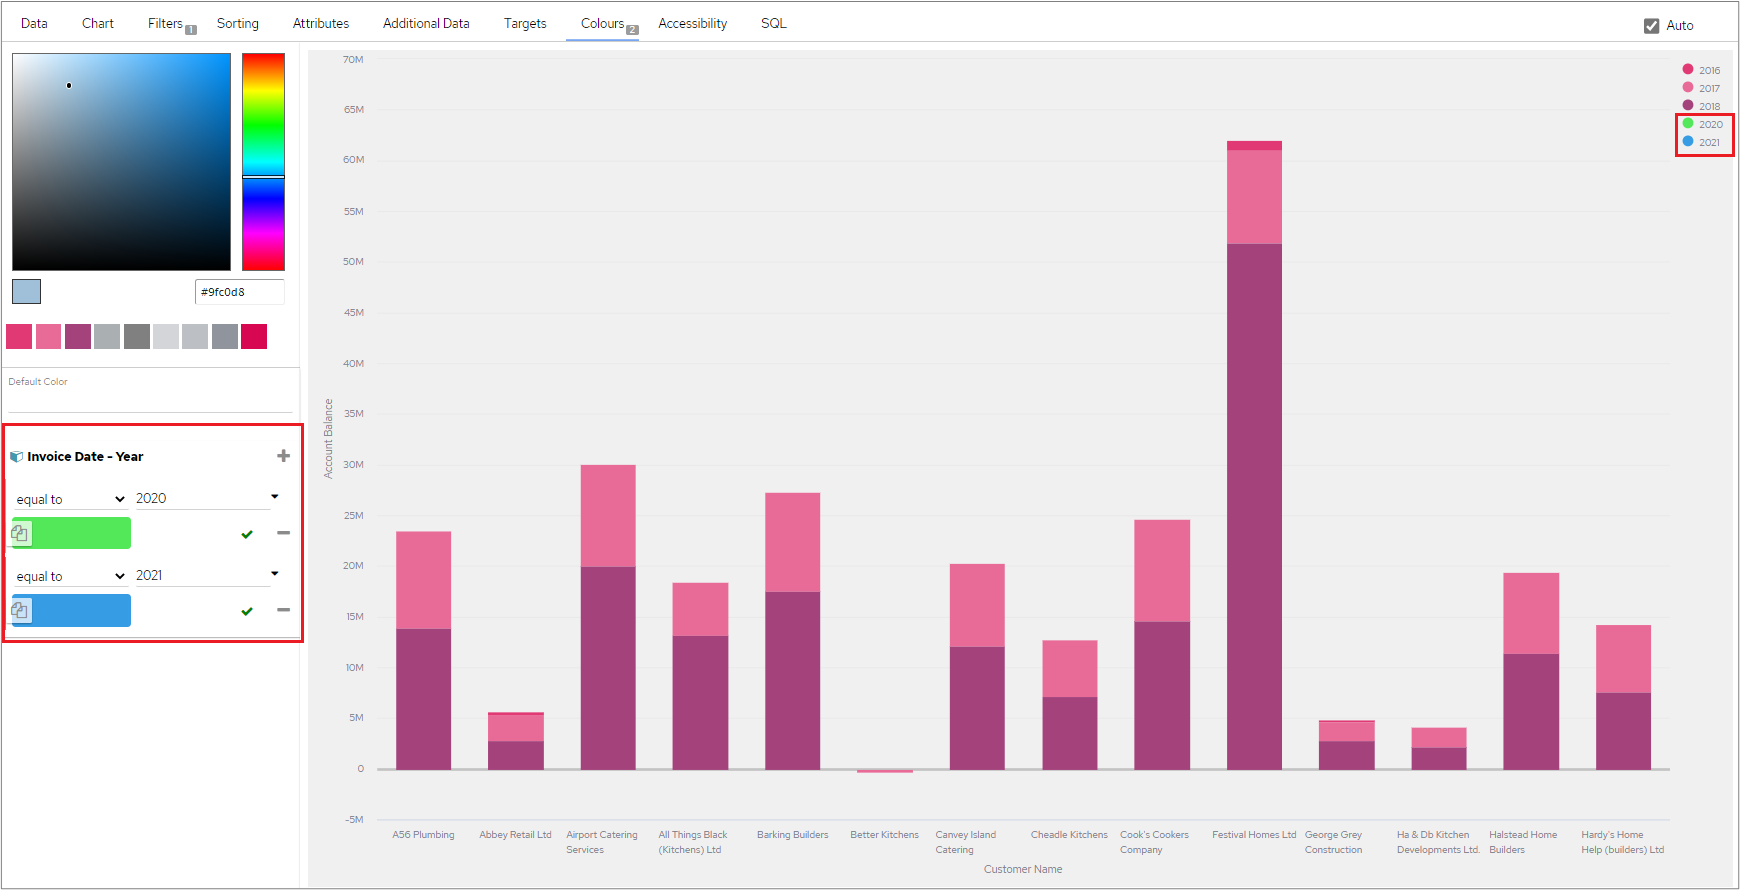
This functionality allows defined colour values to appear in the legend even if the related values do not exist in the data. This option is only available for chart types that can display a Legend, please refer to the following list of Chart Types for clarification:
Bar/Column/Area chart
Stacked Bar/Column/Area chart
100% Stacked Bar/Column/Area chart
Spline/Step Area chart
Line/Spline/Step Line chart
Scatter/Bubble chart
Waterfall charts
Column Range charts
Pie/Doughnut
Pie/Doughnut Variable Radius
Spider/Radar/Wind Rose
Funnel/Pyramid
Video
We’ve created a short video to explain this in a bit more detail.
It is now possible to edit the size of rotated table columns (rows) in the same way as regular tables. Both the header column and the rows can be resized using percentage/ratio or absolute sizing. This can be done in the chart editor in the ‘Attributes’ section.
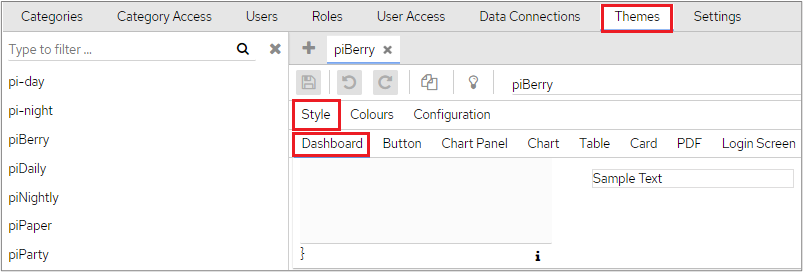
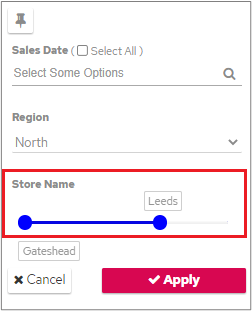
It is now possible to style the Slider category object. In the themes panel, under style/dashboard, there is a new class '.pi-style__category-objects-slider.category-object-slider .pi_style__slider-generic-definition'.
This will alter the style of the slider when the category object panel is open.
In order to change the colour of the slider, add a ‘background’ style as shown below.
The styles will apply to the two handles and the connecting bar.
On both the User and Settings variables screens an ‘i' information icon appears if a new variable is added which is the same as a variable that has already been already defined. This includes magic (unseen) variables as well as user and system variables. Any variable which overrides a variable already defined in the system, will have it’s security level set to the same as the variable which has already been defined and this cannot be modified. A warning will be displayed when users hover over the i icon.
In addition to this, if you add the same variable name twice the following message will be displayed.
Video
We’ve created a short video to explain this in a bit more detail.
There is now a new section in the Chart Editor called ‘Additional Data’. This section allows users to add additional data that can be configured to hidden for charts in addition to the currently available option for tables.
It also means that users will no longer need to add data to a table, and set it to invisible in the ‘Attributes’ section. Instead, they will add hidden data for both charts and tables in the new ‘Additional Data’ section.
Any existing setup for hidden table column configuration will continue to work, the only change is that dashboard has been configured to also allow hidden data for charts.
For more information, please refer to this section.
If you have already set columns in Tables to invisible, the information will be retained but will be moved from the ‘Attributes’ section to the new ‘Additional Data’ section.
For Tables, you will be able to use Dimensions and Measures as hidden data but you will only be able to add Measures as hidden data for other chart types such as Bar Charts.
Video
We’ve created a short video to explain this in a bit more detail.
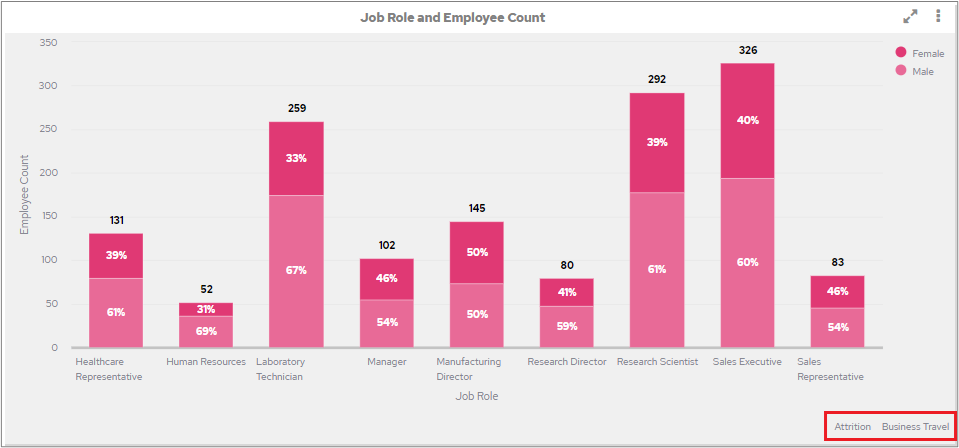
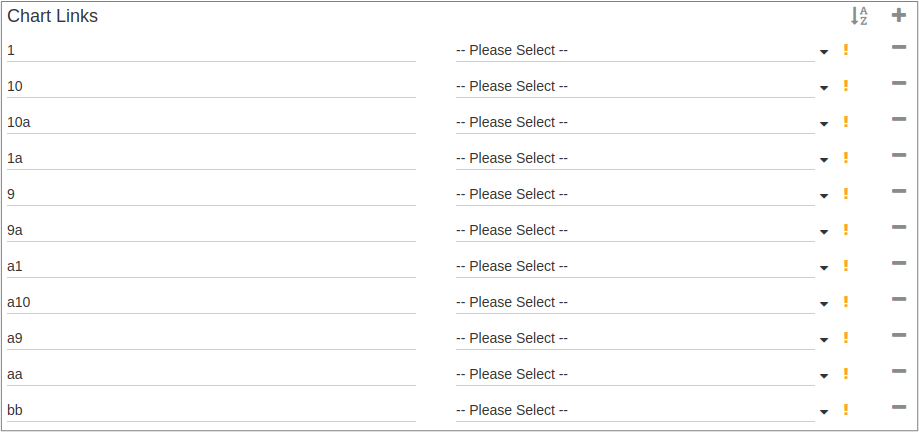
By default, the Link Buttons will appear in the order they were added in the Chart Configuration screen. If preferred, you can sort them into alphabetical order by clicking the sort button at the top-right of the Chart Links section.
Clicking the sort button will order the link buttons into ascending order.
When the changes have been saved, the alphabetical sorting will be reflected on the chart:
Video
We’ve created a short video to explain this in a bit more detail.
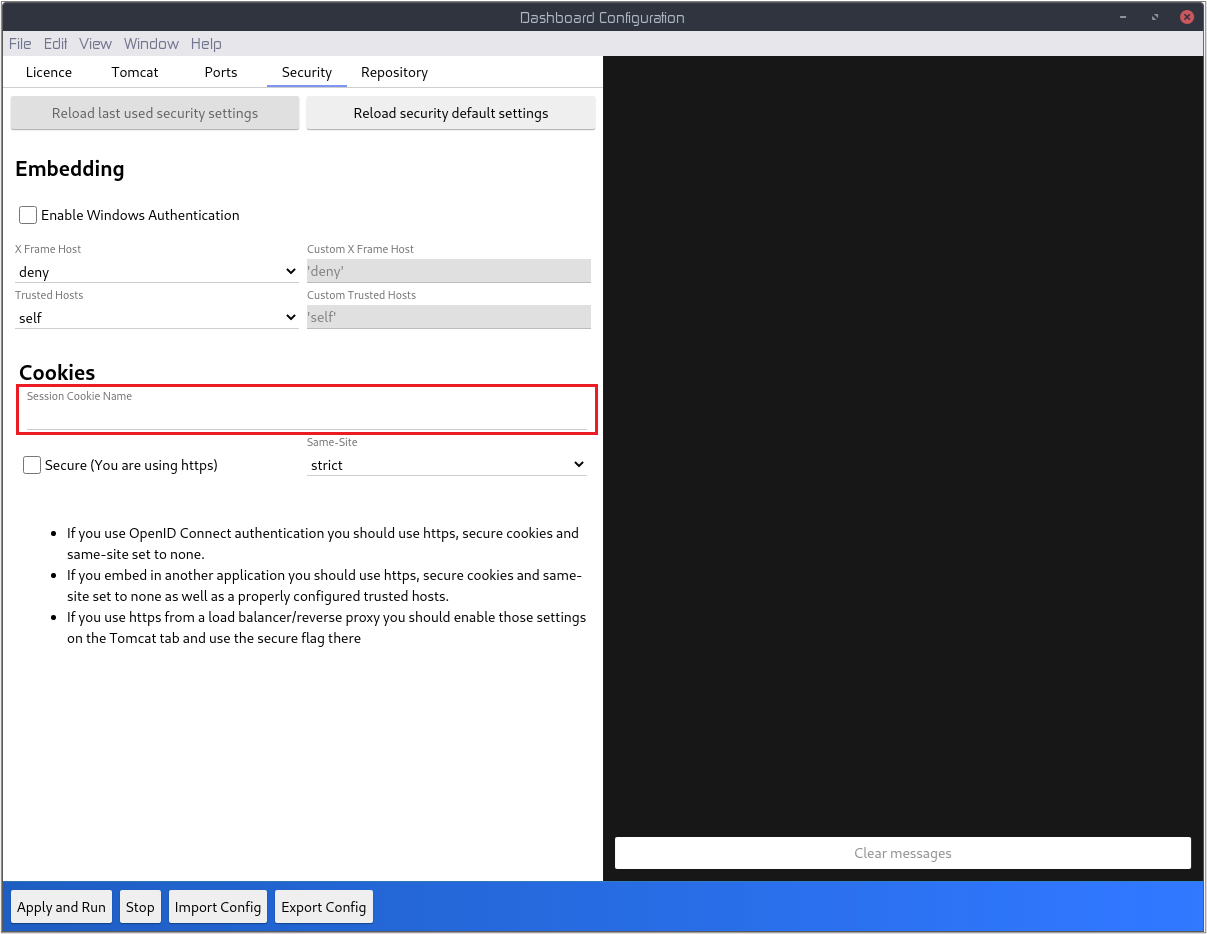
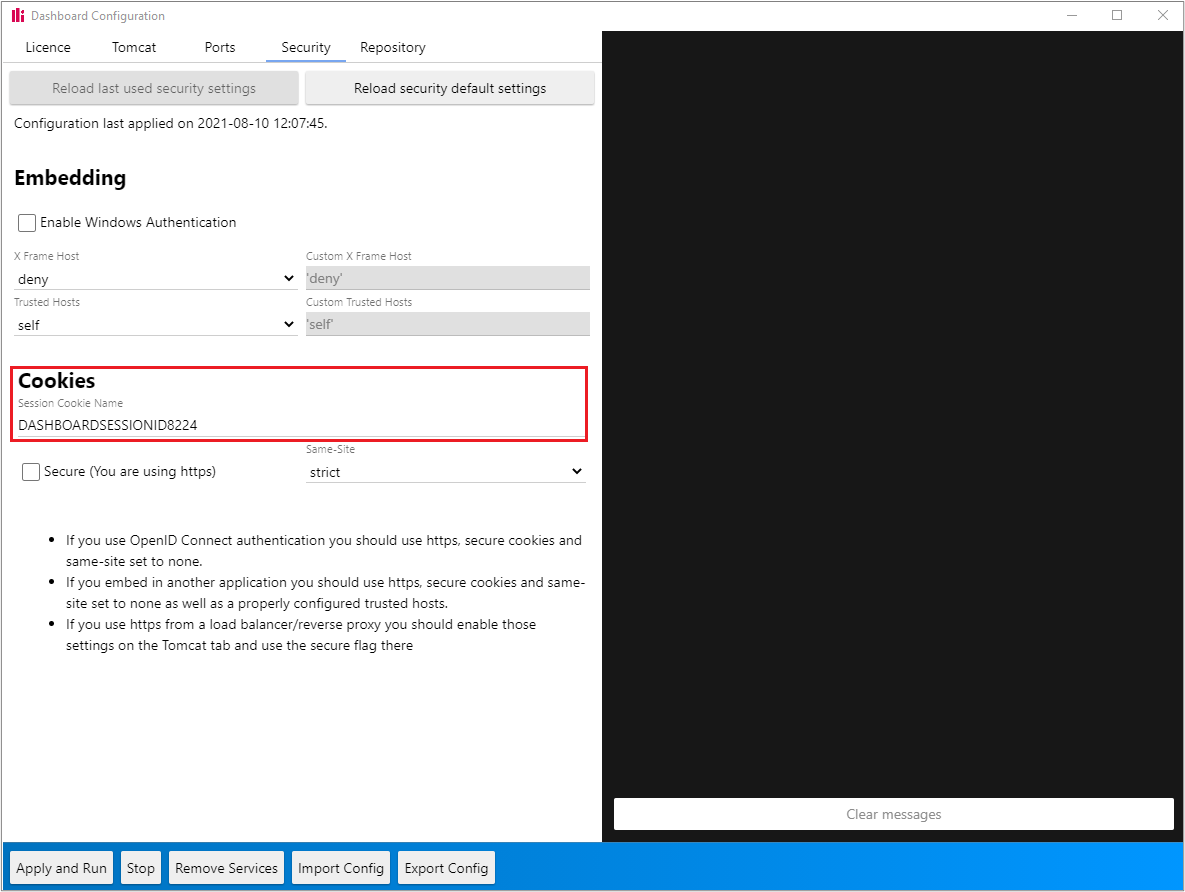
The session cookie is how the dashboard knows whether a user is logged in. This cookie must have a specific name to tie the user with a particular dashboard. Otherwise, if you have two separate dashboard instances, logging in to one would invalidate the session with the other one.
Additionally, if you’re load balancing between various dashboard nodes and synchronising the sessions (see Load Balancing), it's important that the session cookies have the same name.
The cookie name defaults to DASHBOARDSESSIONID<port> (if your dashboard is running on port 8224, it would be displayed as DASHBOARDSESSIONID8224).
You can add the Session Cookie Name in the Configuration Tool.
As a configuration environment variable:
PI_TOMCAT_COOKIE_NAME=CustomSessionCooieNameHere
Or as an item in the json configuration file:
{
    //...
    "tomcat": {
        //...
        "cookies": {
            "secure": false,
            "sameSite": "strict",
            "sessionCookieName": "CustomSessionCookieNameHere"
        }
    },
    //...
}
If you’re not doing advanced configuration, this isn’t something you need to worry about.
Video
We’ve created a short video to explain this in a bit more detail.
Fixed
When exporting a table as PDF, the table chart cell was filling the entire page when a background colour had been applied to the cell using styling.
In the following screenshot, you can see that the background colour fills the entire cell.
Following the release of the August patch, this is how chart cells with a background colour will now appear.
System emails now support SMTP email servers using the following protocols: TLSv1.3, TLSv1.2, TLSv1.1, TLSv1, SSLv3, SSLv2Hello. Under SMTP settings TLS must be selected to use the TLS protocols and SSL selected to use the SSL protocols.
If you have a table set up as a parent chart and you click on a row in that table, the scroll position will remain on the selected row and will not reset to the top of the table.
Occasionally table duplication would happen in the same chart cell when users drilled up to a table in full screen mode.
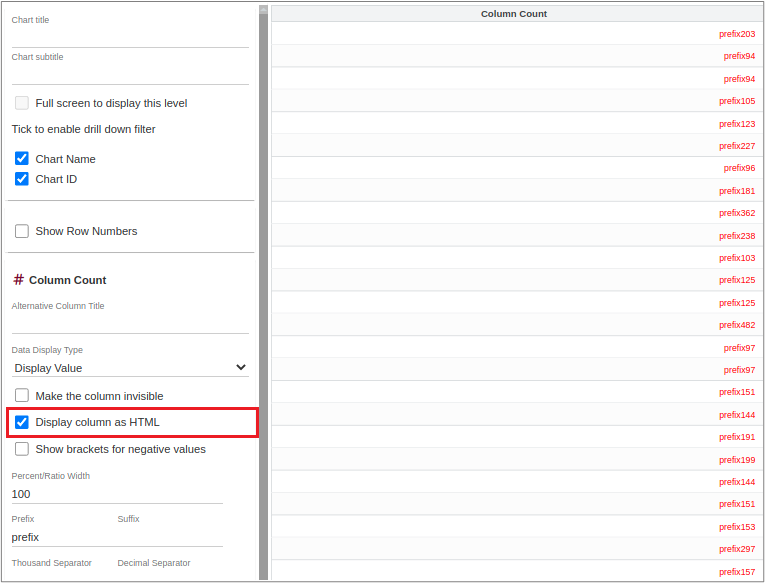
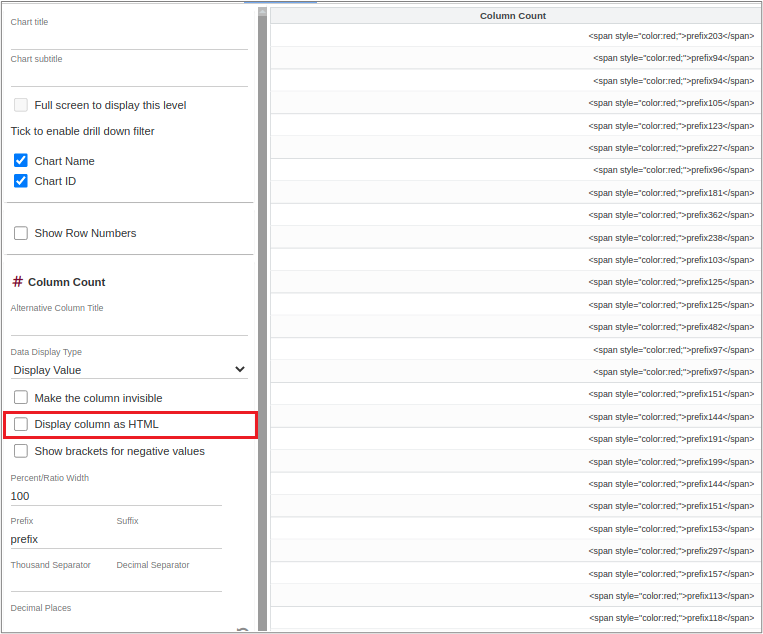
By default, the ‘Display Column as HTML’ attribute is disabled in the Chart Editor screen and data in columns will therefore be displayed as regular text.
When the ‘Display Column as HTML’ field is enabled, values will be displayed as HTML.
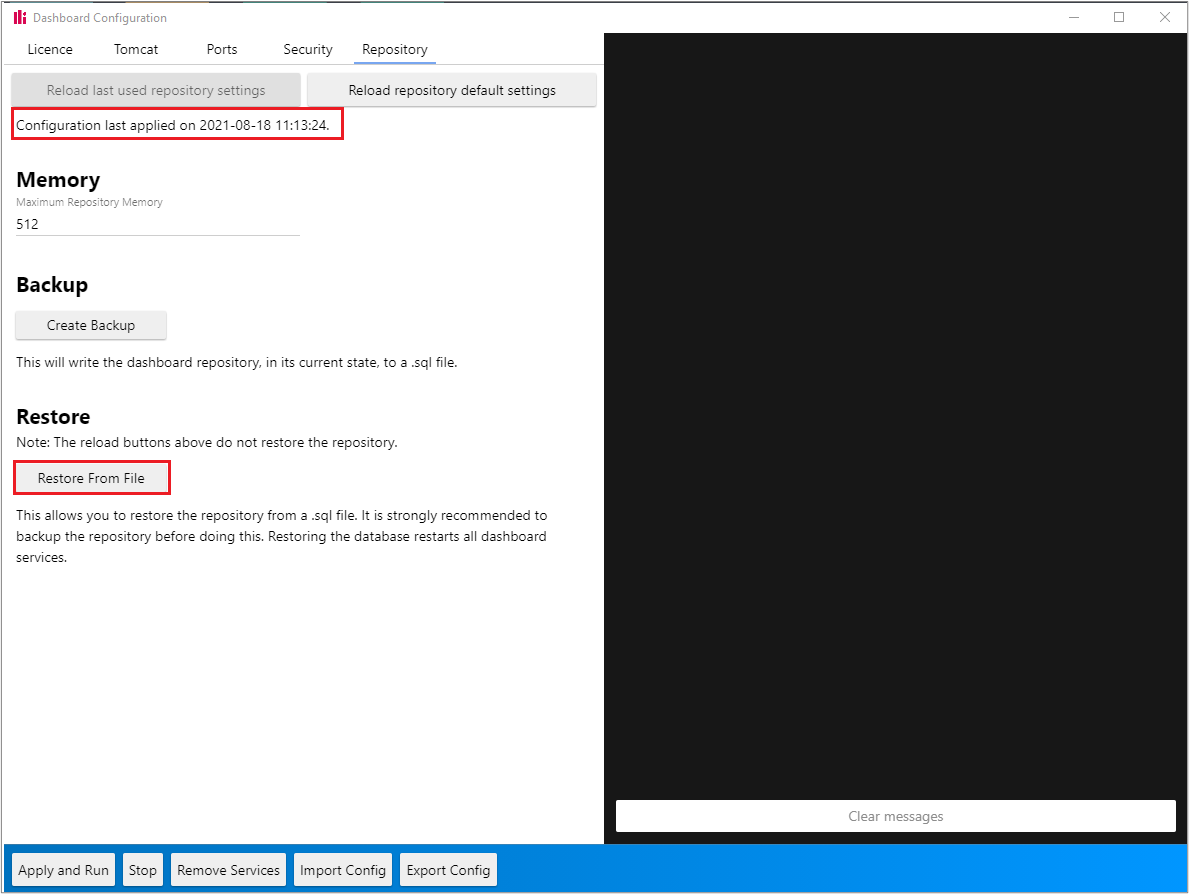
The restore button will be disabled unless configuration has previously been run. A message will be displayed saying that configuration must be run before using restore. The following screenshot shows that configuration was last run on 18/08/21 and in this case the Restore button is active.
Please note that when using restore the dashboard services are left running.
Chart filters were resetting when the dashboard was restarted. Now, when the dashboard is restarted the filters remain in the same state they were before restarting.
Tooltips on custom maps are appearing at the top of the screen when in full screen mode. A timeout has been set as a workaround in the interim to address this problem.
Functionality has been added that will retain the current sort order in tables when drill levels have been specified. If a table has been sorted and a user then drills down to a Drill level, the sort order will be retained when they drill back up to the previous level. This applies to standard, crosstab and merged tables.
Functionality has been added, which will retain the position that a user has scrolled to prior to using a drill level. For example, if a user has scrolled down the table, clicked on a row to drill down and then returned to the previous level the scrolling position will remain at the same level as the row they clicked on to drill down instead of moving back to the top of the table.
Both vertical and horizontal scroll position will be preserved for crosstabs and rotated tables. The vertical position only will be saved on standard tables.
The scroll position will be centred in the middle of the area of the row the user clicked on. It will not specifically point to the row they clicked on but will remain centred around the same area meaning that it will be easy to navigate without having to scroll through the entire table again.
When Admin users were changing the theme for a user that did not have the permission ‘Can Change Own Theme’ enabled, changes to a new theme were not being saved correctly and the system was reverting back to the current theme.
When an object is defined as a number and the object is then used in a table as a column the column was being sorted alphanumerically rather than numerically.
Columns in tables that contained null values were not sorted correctly. Now, when a column contains nulls and you sort by clicking on the header of the column, nulls will appear at the top when ascending order is selected and at the bottom when descending order is selected. This applies to tables, crosstabs and editable tables.
If a user created a Data Object that included Object Replacement in the select statement and the object also contained an Order By, the Order By from the Object Replacement was being used instead of the one defined on the Data Object itself.
This has been changed to use the Order By defined on the Data Object if one has been specified. If Order By has not been specified on the Data Object, the system will use the one defined in Object Replacement.
When pagination had been added to a table and the table was then added to a pi Report extra spacing and navigation buttons were displaying in the report. Any table that contains pagination will now display display in pi Reports.
When tables were exported they occasionally appeared as either blank or with missing data. A change has been made to how the renderer processes the data which will address this problem.
When the names allocated to Chart Links contain numbers and characters they were not being sorted correctly when the sort button was used in the Chart Configuration screen. A change has been made that will ensure that any names that contain both will now be sorted correctly in alphabetical order.
When large tables were exported to Excel, typically tables where the number of rows multiplied by the number of columns, exceeded 100,000 cells, rows of data were missing from the exported file. A warning message will now be displayed on tables that exceed this size and the table will be exported without styling. Tables that do not match these conditions i.e. those containing less than 100,000 cells will be exported as normal, with styling.
If you experience problems exporting large files to Excel, please consider increasing your tomcat memory, you should be able to see an exception, ‘Java heap out of memory’ in the dashboard logs.
We recommend exporting very large table to CSV.
When installing into a folder that contains \t (lowercase t) e.g. C:\Program Files\test the installation was failing.
The session cookie name that is used to distinguish user sessions is now updated by the configuration tool and will default to DASHBOARDSESSIONID<port>. For example, if your dashboard is running on port 8224 the session cookie name will be DASHBOARDSESSIONID8224.
This will prevent users from being logged out of one dashboard instance when they login to another separate instance.
Emails which were not being sent due to incorrect SMTP settings are now being reported to the monitoring screen in the scheduling section of the dashboard.
Extra error logging has been introduced in cases where there is missing data from the Dashboard or the data is incorrect. Scheduler will now flag these cases as errors in the logs, the logs were introduced after Scheduler failed when there was no data available for a monthly schedule.
Keeping An Eye On pi
pi Documentation - this area is where we store all our documentation. Please take a look - you can see what’s been added recently in the ‘Recently Updated’ section on the Home Page or by clicking the Pages link on the left hand side of the screen.
pi Community - this is an area where you can see recently asked questions and ask your own questions., and connect with other pi users from other companies - designed to help you connect and get the most from our community of users. You can register for an account really quickly by clicking the link at the top right of the screen or if you prefer you can even ask a question without creating an account
Customer Portal - don’t forget to download the latest release from here.
SupportDesk - log all your support tickets and see what’s happening on your previously logged tickets through our Support Portal
pi News - have a look at this area on our website, you’ll be able to see all the latest Panintelligence news
pi Academy - try one of our training courses and read through and watch some of our training materials
pi Social - see what’s going on at Panintelligence on one of our social media sites









0 Comments