You can find a live code example that details how to embed the dashboard in your dashboard installation.
If your dashboard is installed locally with all the default settings, to access the example go to http://localhost:8224/pi_embed_example/.
Embedding A Panintelligence Chart
Step 1 - Ensure your dashboard is running in HTTPS
See Configuring HTTPS for more information.
Step 2 - Configuring the Dashboard
By default, embedding the dashboard in an iframe will no longer work without configuration. This is by design to provide the most secure out of the box configuration.
We have implemented click-jacking protection in the form of the recommended 'frame-ancestors'. By default, this is configured to disallow any embedding from any site. This can be changed via the Panintelligence Configuration Tool.
Using the Configuration Tool
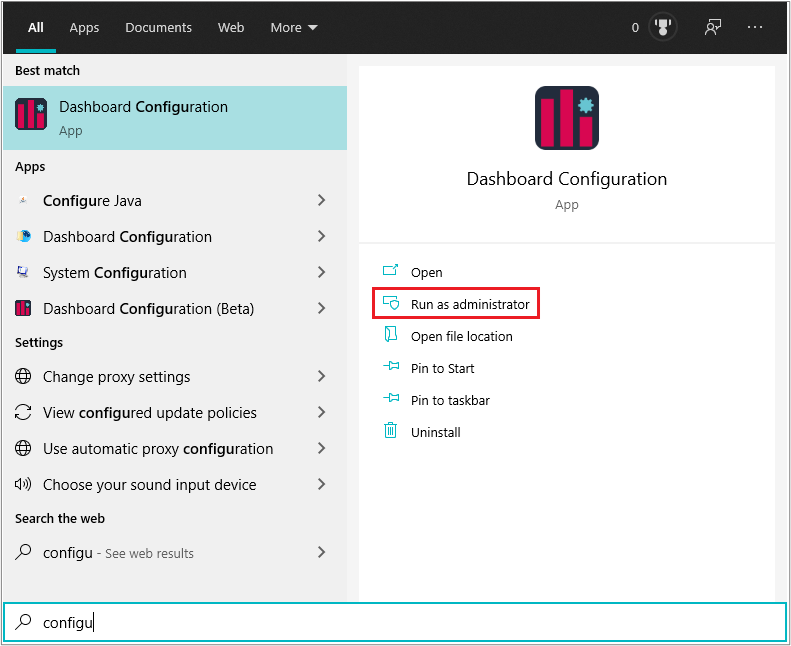
On Windows
You can get to the Configuration Tool via the Start menu:
Or by navigating to the Dashboard installation folder. On Windows, the default location is C:\Program Files\Dashboard\Dashboard:
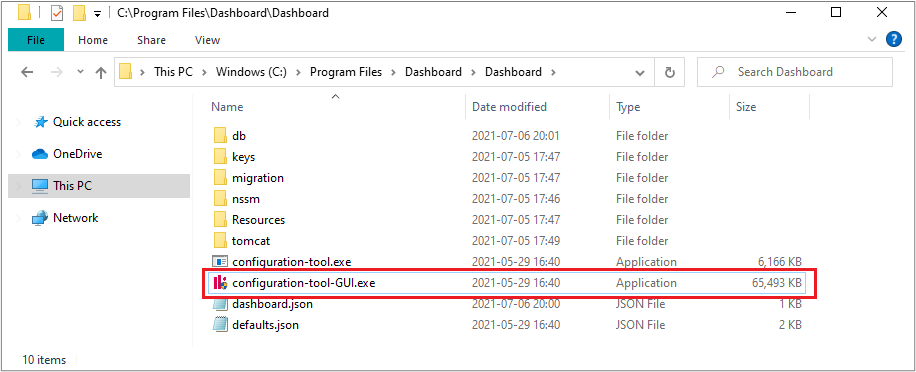
Please ensure that you run configuration-tool-GUI.exe as an administrator.
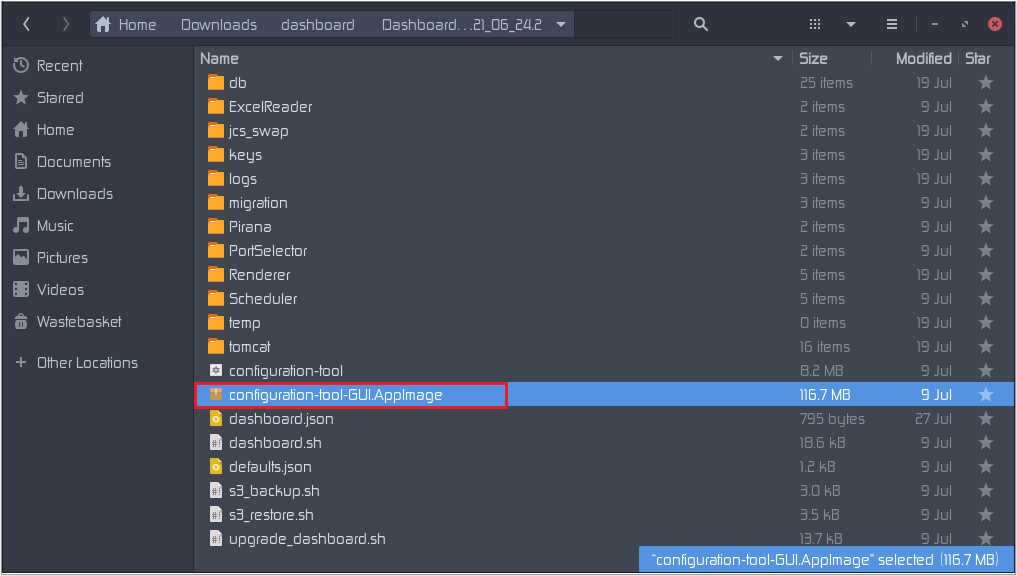
On Linux
Double click configuration-tool-GUI.AppImage.
Editing the CORS / Frame Ancestors / Trusted Hosts and the Cookie settings
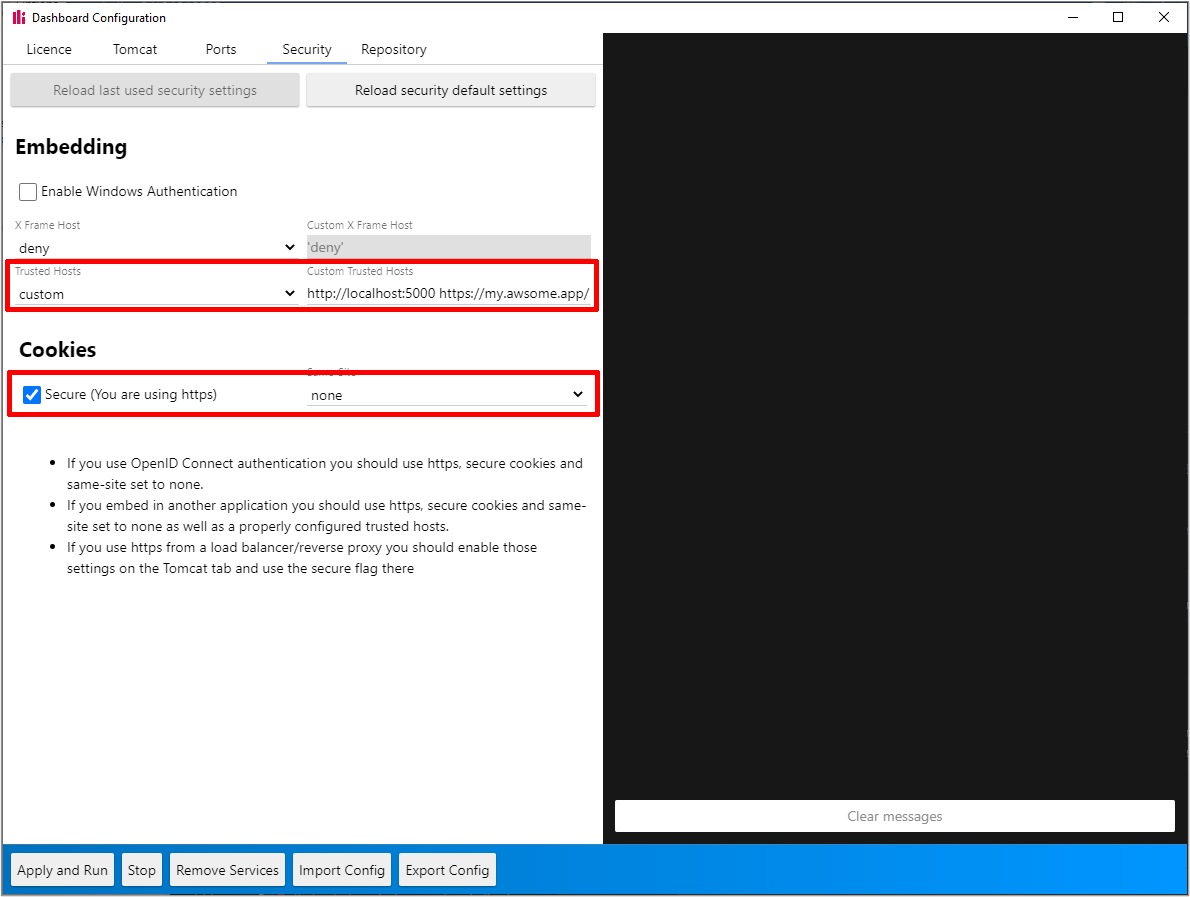
From the Trusted Hosts dropdown you’ll see the following values:
none: No embedding allowedself: Embedding allowed from the same hostcustom: Embedding allowed from the hosts specified in the space separated list
Protocol (http/https) is required for trusted hosts / frame ancestors when using a wildcard.
Using the configuration file
These settings can also be applied via a configuration file to support unattended installs and GUI-less environments.
To do this, find or create a file named dashboard.json next to the configuration tool:
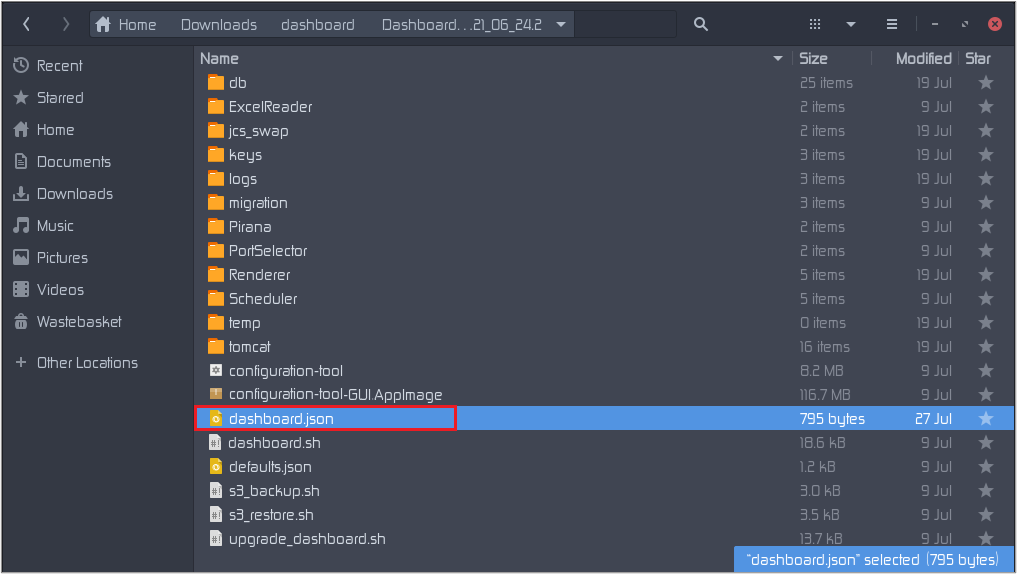
Then edit it using your favourite editor. You’ll need to change tomcat.cookies.secure, tomcat.cookies.sameSite and security.trustedHosts.


Protocol (http/https) is required for trusted hosts / frame ancestors when using a wildcard.
Step 3 - Getting a token
You can run a working example by following this repository:
In our examples, we’re doing this in the frontend just so you can follow a full example.
However do not do this in production, you’ll be exposing your password!
Typically your backend communicates with the dashboard in order to get the token. Once in place, your frontend then just uses it.
You can use our API to fetch a token for any user. Below we’ve got an example in javascript using jquery:
var url = "https://localhost:8224/" //Change this to your url
var username = "admin" //Change this to the user you want to login as
var password = "dashboard" //Change this to user's password
$.ajax({
    // POST to the API with username and password to swap that for a session token
    type: "POST",
    url: url + apiToken,
    contentType: "application/json",
    xhrFields: {
        withCredentials: true
    },
    beforeSend: function (xhr, settings) {
        xhr.setRequestHeader("Authorization", "basic " + username + ":" + password);
    },
    success: function (data) {
        login(data.token);
    }
});

function login(token) {
    // Issue an ajax request to embeddedTokenLogin with the token in the header to pick up the session cookies
    $.ajax({
        type: "GET",
        url: url + "pi/auth/embeddedTokenLogin",
        contentType: "text/HTML",
        xhrFields: {
            withCredentials: true
        },
        beforeSend: function (xhr, settings) {
            // This is the header we need to set
            xhr.setRequestHeader("Authorization", "bearer " + token);
        },
        success: function (data) {
            // Once we have a succesful ajax request with authentication we can load the charts in the iframes
        }
    });
}
Step 4 - Embedding
Chart
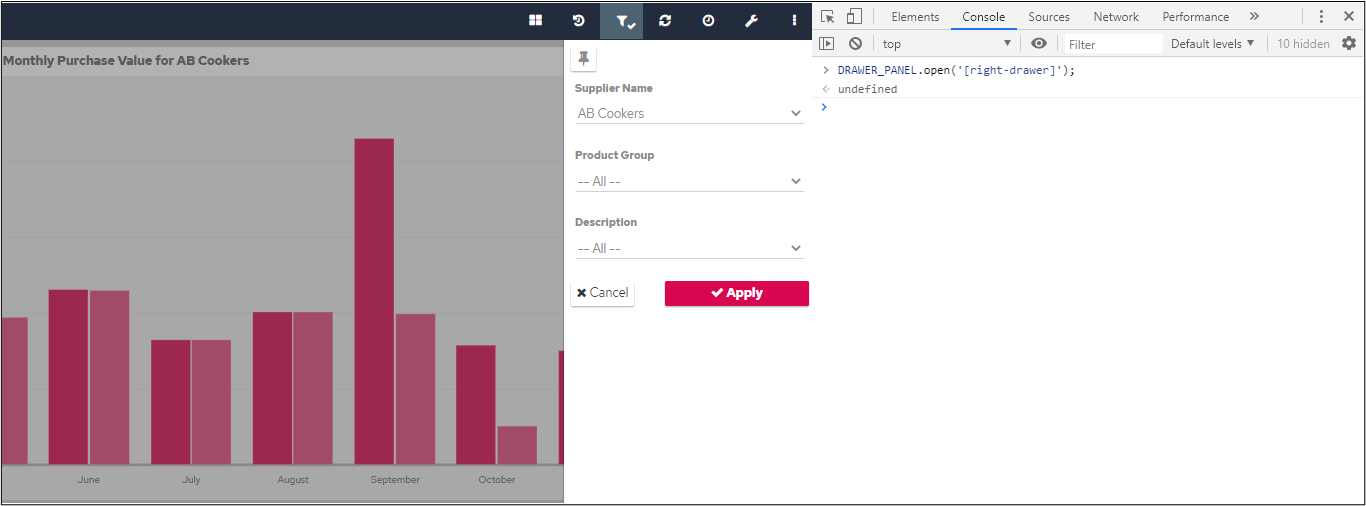
To embed a chart you’ll need an iframe and the chart’s ID. You can get this by going into the dashboard, clicking chart tools at the top-right of a chart cell and selecting the i icon:
Then copy the code snippet:

<iframe id="chart_iframe" src='https://your.dashboard.com/pi/chart#chart-filter/481__1' width="500" height="500"></iframe>
You should probably only update/show the iframes once the user has been logged in.
That would change the login code to be more like:
function login(token) {
    // Issue an ajax request to embeddedTokenLogin with the token in the header to pick up the session cookies
    $.ajax({
        type: "GET",
        url: url + "pi/auth/embeddedTokenLogin",
        contentType: "text/HTML",
        xhrFields: {
            withCredentials: true
        },
        beforeSend: function (xhr, settings) {
            // This is the header we need to set
            xhr.setRequestHeader("Authorization", "bearer " + token);
        },
        success: function (data) {
            document.querySelector("#chart_iframe").src = "https://your.dashboard.com/pi/chart#chart-filter/481__1"
        }
    });
}
Category
We have embedded a chart but what if we want to embed a category? Embedding a category isn’t actually any different from embedding the whole dashboard (yes, you can do that too!).
Below are the different category modes that you can use when embedding the categories:
categoryMode=0: Normal
This will show the category exactly as it appears on the dashboard.

categoryMode=1: Headless Single Category
This will hide the category header and the category list.

categoryMode=2: Single Category
This will show the category header options but will still hide the category list.

categoryMode=3 Headless Normal
This will remove the header but keep the category list.

Interacting with the Left/Right panels
One thing to note with the different embed options is that you can actually use JavaScript to open the category list / filter panel within the various modes if you wish to (and if they’re available in that category mode).
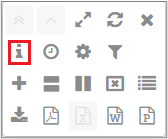
The left drawer tag will open the category list as long as the embed mode allows for the category list to be active (Options 0 and 3)
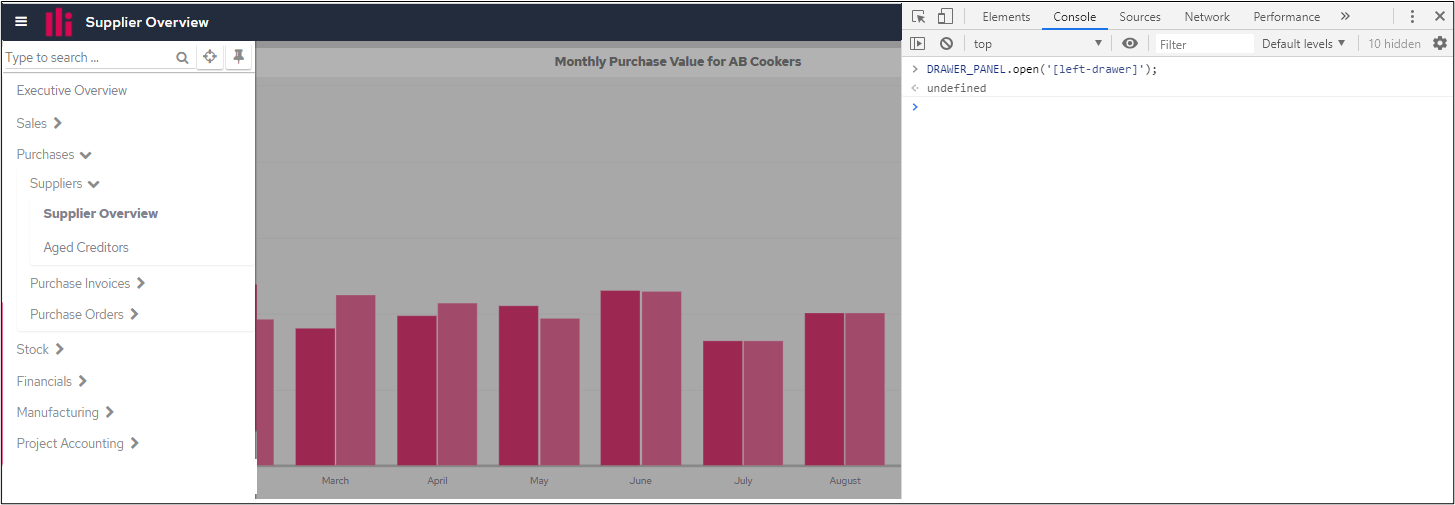
The right drawer tag will open the filter panel for every embed mode available.
Using filters to filter a chart via JavaScript while embedded
With Category Filters (whole category)
Adding filters
To add category-level filters to all the charts in the category, you must have something with the following pattern:
scheme://host:port/pi/#PA-CA###category/id/c-o-p=FILTERS
For example:
Filtering the category with Department = Dev:
https://localhost:8224/pi/#PA-CA###category/141/c-o-p=eq__[[Department]]{{dev}}
Filtering the chart with Department = Dev and Number > 100:
https://localhost:8224/pi/#PA-CA###category/141/c-o-p=eq__[[Department]]{{dev}}/*$*gt__[[Number]]{{100}}
With Temporary Filters (per chart)
Adding filters
To add temporary filters to the charts, you must have something with the following pattern:
scheme://host:port/pi/chart#chart-filter/id/t-f-p=FILTERS
For example:
Filtering the chart with Department = Dev:
https://localhost:8224/pi/chart#chart-filter/330__1/t-f-p=eq__[[Department]]{{dev}}
Filtering the chart with Department = Dev and Number > 100:
https://localhost:8224/pi/chart#chart-filter/330__1/t-f-p=eq__[[Department]]{{dev}}/*$*gt__[[Number]]{{100}}
Types of filters
Filter Name | Pattern | Object Types | Examples |
|---|---|---|---|
Equals |
| Dimension |
|
Measure |
| ||
Greater than |
| Dimension |
|
Measure |
| ||
Lower than |
| Dimension |
|
Measure |
| ||
Greater or equals |
| Dimension |
|
Measure |
| ||
Lower or equals |
| Dimension |
|
Measure |
| ||
Not equals |
| Dimension |
|
Measure |
| ||
Like |
| Dimension |
|
| Measure* |
| |
Not Like |
| Dimension |
|
| Measure* |
| |
Top |
| Dimension |
|
Measure |
| ||
Bottom |
| Dimension |
|
Measure |
| ||
In |
| Dimension |
|
Not In |
| Dimension |
|
Between |
| Measure |
|
Not Between |
| Measure |
|
*May not work for some databases
Upper/lower case values make a difference!
Delimiters
/*$* - Used to separate multiple criteria items
:::: - Used to separate values within {{}}, used for Between/Not Between and In/Not In list criteria