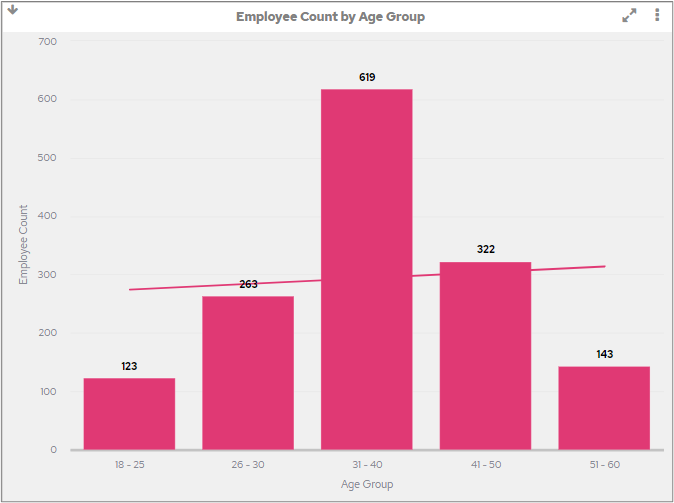
This option is only available for certain chart types, usually column or bar charts, and is used to display a linear trend line on a chart. This line is a simple regression line.
Example
This example shows a bar chart with a Trend Line. Two trend lines appear on the chart: one for each item in the Legend.
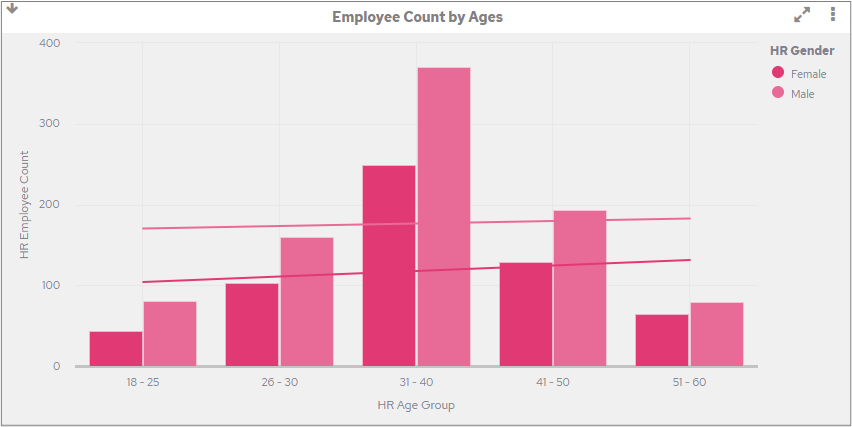
The Trend Line colour will be taken from the colours used in your chart. In the following example, we can see that the colour of the Trend Line matches the colour of the bars.