Normally to create a fully functioning Dashboard we will need to reference more than one table/view and the table join(s) will need to be defined in the dashboard.
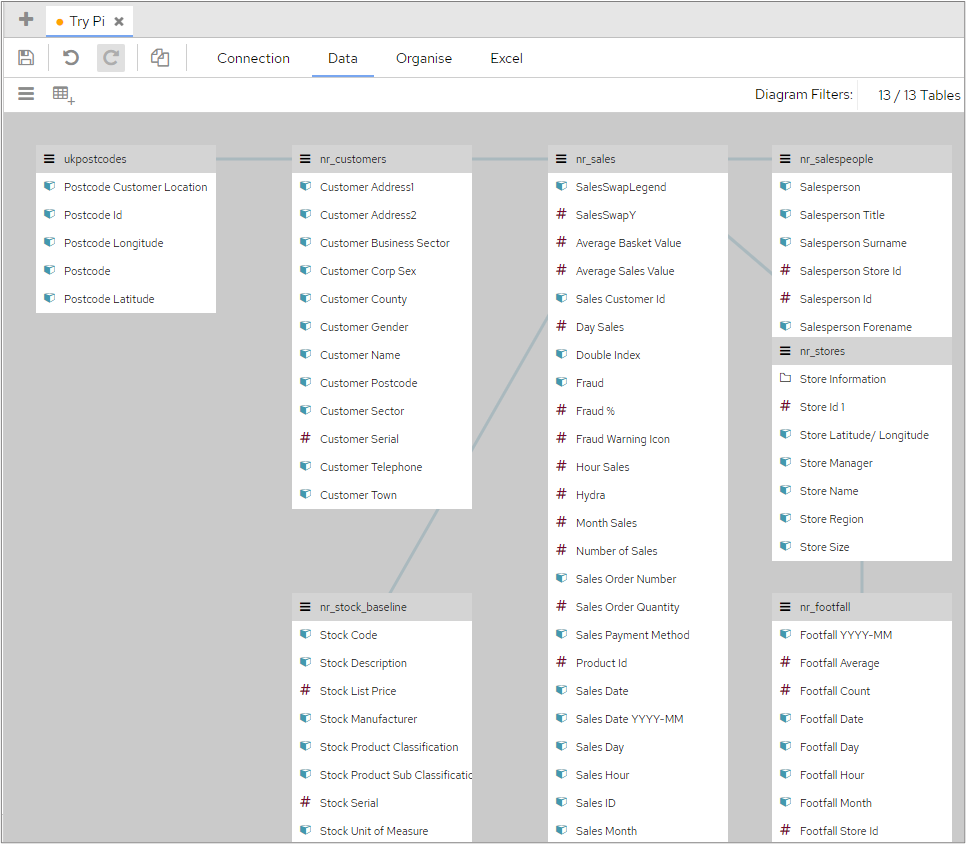
The screenshot below shows several different tables and the joins, indicated by the blue lines, between them.
Creating a Join
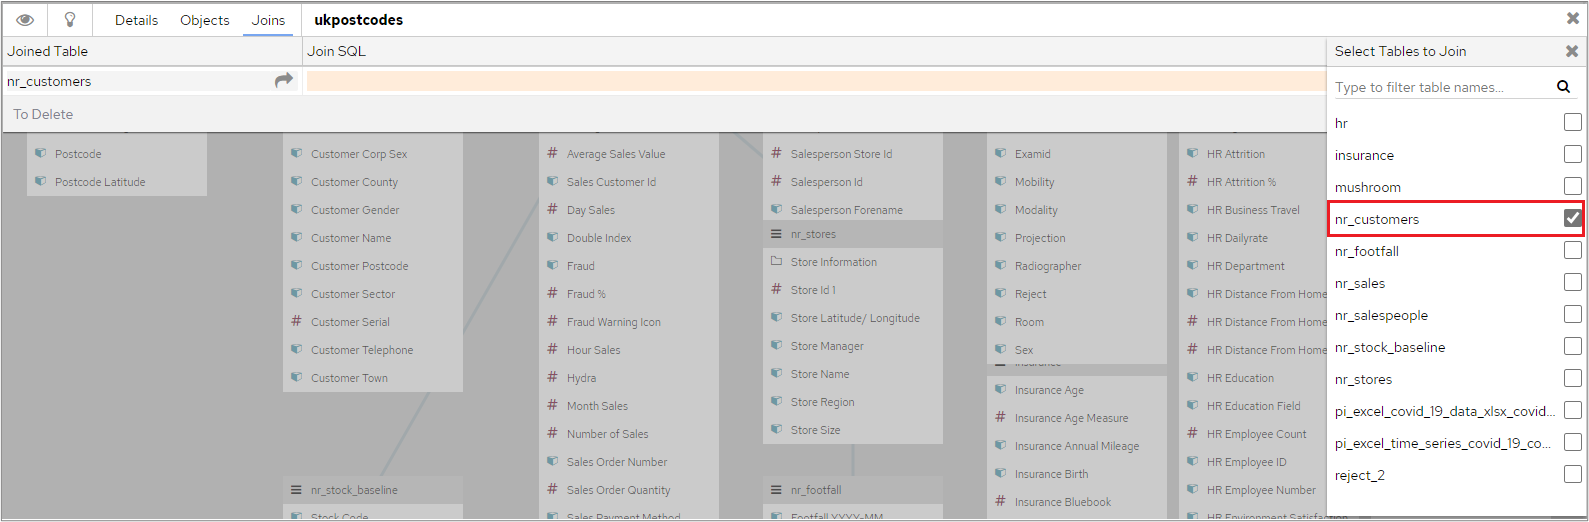
To create a join, click onto the header of the table we want to join from and click on the ‘Joins’ tab, this time however click on the ‘Add’ icon to create a new join.

You will then be presented with a list of the tables/ views already configured in this data connection. Click the one you want to join to and the line for this join is created.
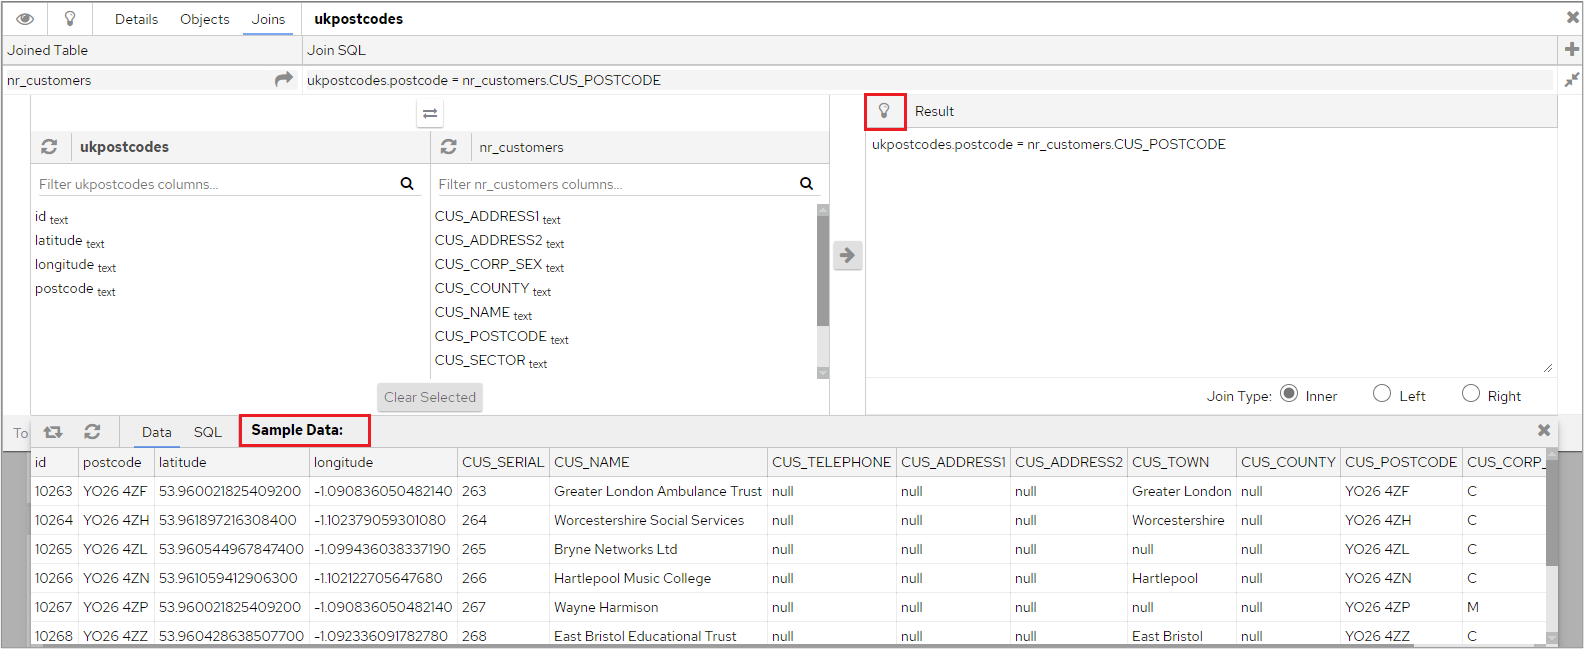
Clicking on the newly created line at the top of the screen will display the columns in each table.
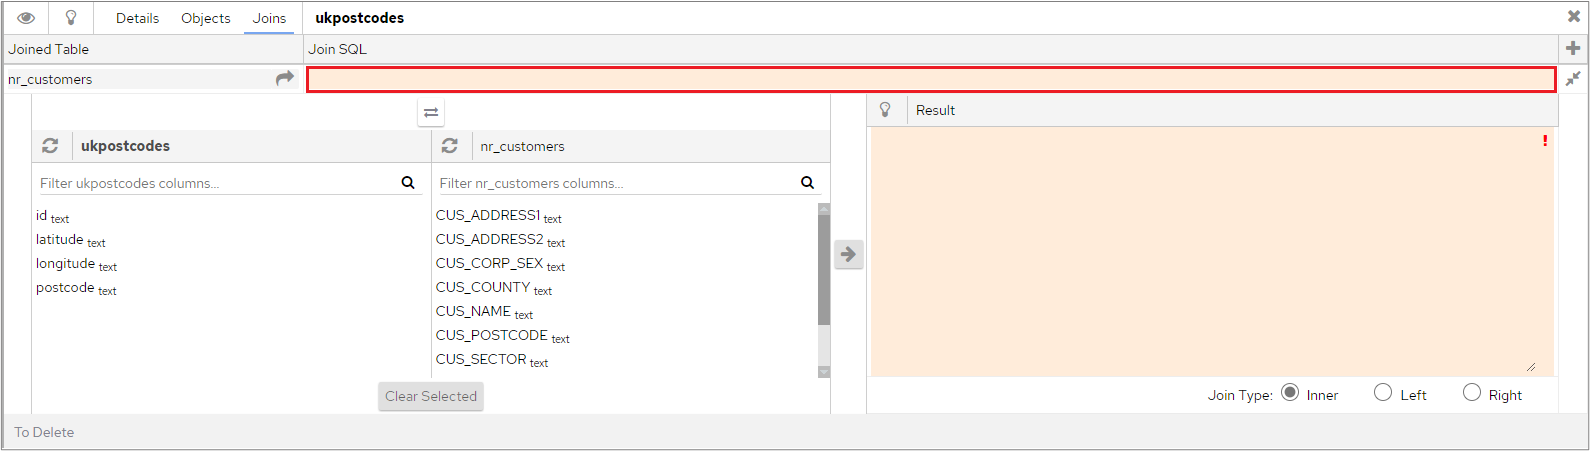
At this stage, you could manually type in the join in the ‘result’ window. Normally however, even if the join is more complex than a simple ‘equal to’, it is better to select the field(s) from each table using the two lists on the left-hand side, which will ensure that the correct aliases and object quotes are pulled through. After selecting the two fields, click the ‘Append to SQL’ button.
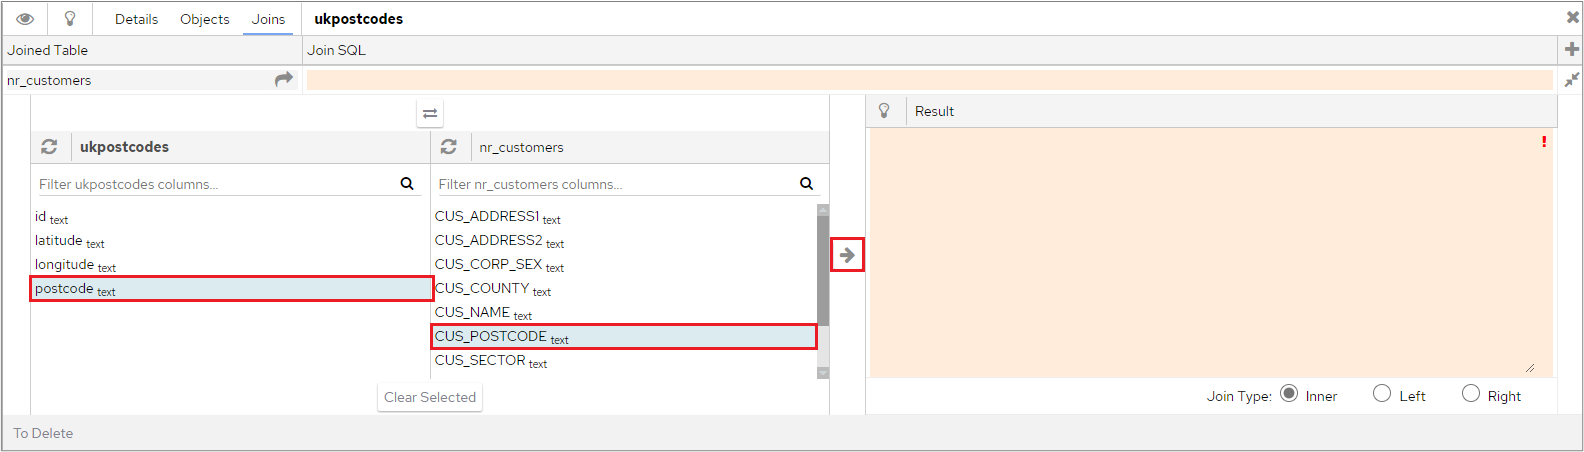
The join will be created and displayed in the Result area.

For more complicated joins you can click on multiple objects before pressing the ‘Append to SQL’ button. You can also manually edit the SQL generated, any SQL syntax that is valid for your database type such as hints, substrings, cast etc. can be used.
Testing a Join
After the join has been built it can be tested using the ‘Test join SQL’ icon in the Result area which will return sample data from both tables.
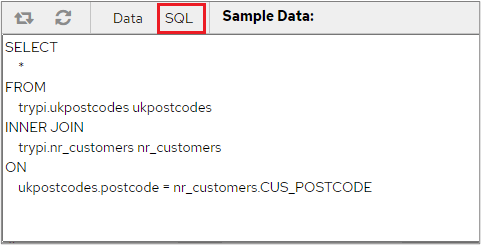
Clicking the ‘SQL’ tab will display the SQL executed to get this result set.
Join Type
The default join type is Inner, but you can also create Left or Right (Outer) joins.

Selecting a ‘left’ join for example would change the SQL generated to.

‘Left’ is the table to the left of ‘JOIN’ immediately after ‘FROM’.
‘Right’ is the table specified in the JOIN statement, i.e. to the right.
In both a left and right join it will always return the rows where there is a match between the two tables, the left and right logic simply determines whether it will also include items where there is no such match.
A left join would return all rows from the left table, even if there were no matches on the right table, in this example all ukpostcodes even if they didn’t have a CUS_POSTCODE.
A right join would return all rows from the right table, even if there were no matches on the left table, in this example all CUS_POSTCODE, even if they didn’t have any ukpostcodes allocated to them.
The default option of inner join will only return rows that match on both tables. For example, if you had a table ‘AccountManagers’ and a table ‘Sales’ and you wanted to show sales per Account Manager in the dashboard including Account Managers with no Sales then you would need to use an outer join, all Account Managers would show and Sales figures would also be shown where there was a match. Whether this was a left or right join would depend on the table order as described above.
The default inner join would only return Account Managers who had Sales and their Sales figures.
Bear in mind that Outer joins can be more ‘expensive’ (database performance wise), you should only use them where there is a genuine need.
Which Joins will it use?
The dashboard will resolve the minimum joins it needs to use to connect the objects you have placed in a chart, bearing in mind the Table Priority. For example, if you had the following Meta Data.

A chart using an object from ‘ukpostcodes’ and an object from ‘nr_customers’ would only resolve the join between those two tables.
If on the other hand your chart had an object from ‘ukpostcode’ and an object from ‘nr_sales’ then it would resolve the join from ‘ukpostcode’ to ‘nr_customers’ and the join from ‘nr_customers’ to ‘nr_sales’.
The same would apply if your chart had objects from ‘ukpostcode’ and ‘nr_customers’ but you also had ‘nr_sales’ as a category object; when the chart SQL was created initially it wouldn’t join to ‘nr_sales’ , but once a category object on the ‘nr_sales’ table had been selected that table would also be joined on the underlying chart SQL.
Forcing a Join / Referencing Fields on Other Tables
There is nothing to stop you in the object ‘Select’ statement referencing a field or fields that doesn’t exist in this table, but on another one that it is joined to (although you would have to set this up manually).
However, if you then built a chart that only used objects from the one table piDashboard wouldn’t automatically resolve the join to the other table and therefore our object and therefore the chart would fail. The dashboard has no way of knowing that one of the objects references a field held on another table.
Example

This object on the order detail line (POPOrderReturnLine) table is referencing a column on the order header table (POPOrderReturn), specifically DocumentTypeID.
If you were to build a chart that included this object but only looked at the order detail line table then it would fail because it has no notion of how to find POPOrderReturn.DocumentTypeID.
In this scenario you need to ‘force the join’ to POPOrderReturn, and generally the easiest way to do this is to add a filter from POPOrderReturn to your chart. This will then force PiDashboard to resolve the join to POPOrderReturn and it will then be able to find POPOrderReturn.DocumentTypeID. This could be a ‘nonsense’ filter such as Order Status <> ‘Micky Mouse’ or it could be something slightly more sensible such as Order Year > 1980, it doesn’t really matter as long as it’s not going to actually restrict the orders you want; you are only doing it to enforce the join.
Deleting a Join
To delete an existing join, click on the header of a table (the grey bar at the top of the table that shows the name of the table).
This will show the following window. To view existing joins, click on the ‘Joins’ tab. In the following example, we can see that the postcode field in the ukpostcodes table is joined to the CUS_POSTCODE field in the nr_customers table.

If we then click the ‘To Delete’ button at the bottom left of the window

the screen will change, and a tick box will be displayed at the end of the join row. To delete this join, select the tick box and then press ‘Delete Selected’.

Having ‘orphaned’ tables is generally a bad idea. Where stand-alone tables are required, they should ideally be placed in a separate data connection(s) specifically for such purposes.